
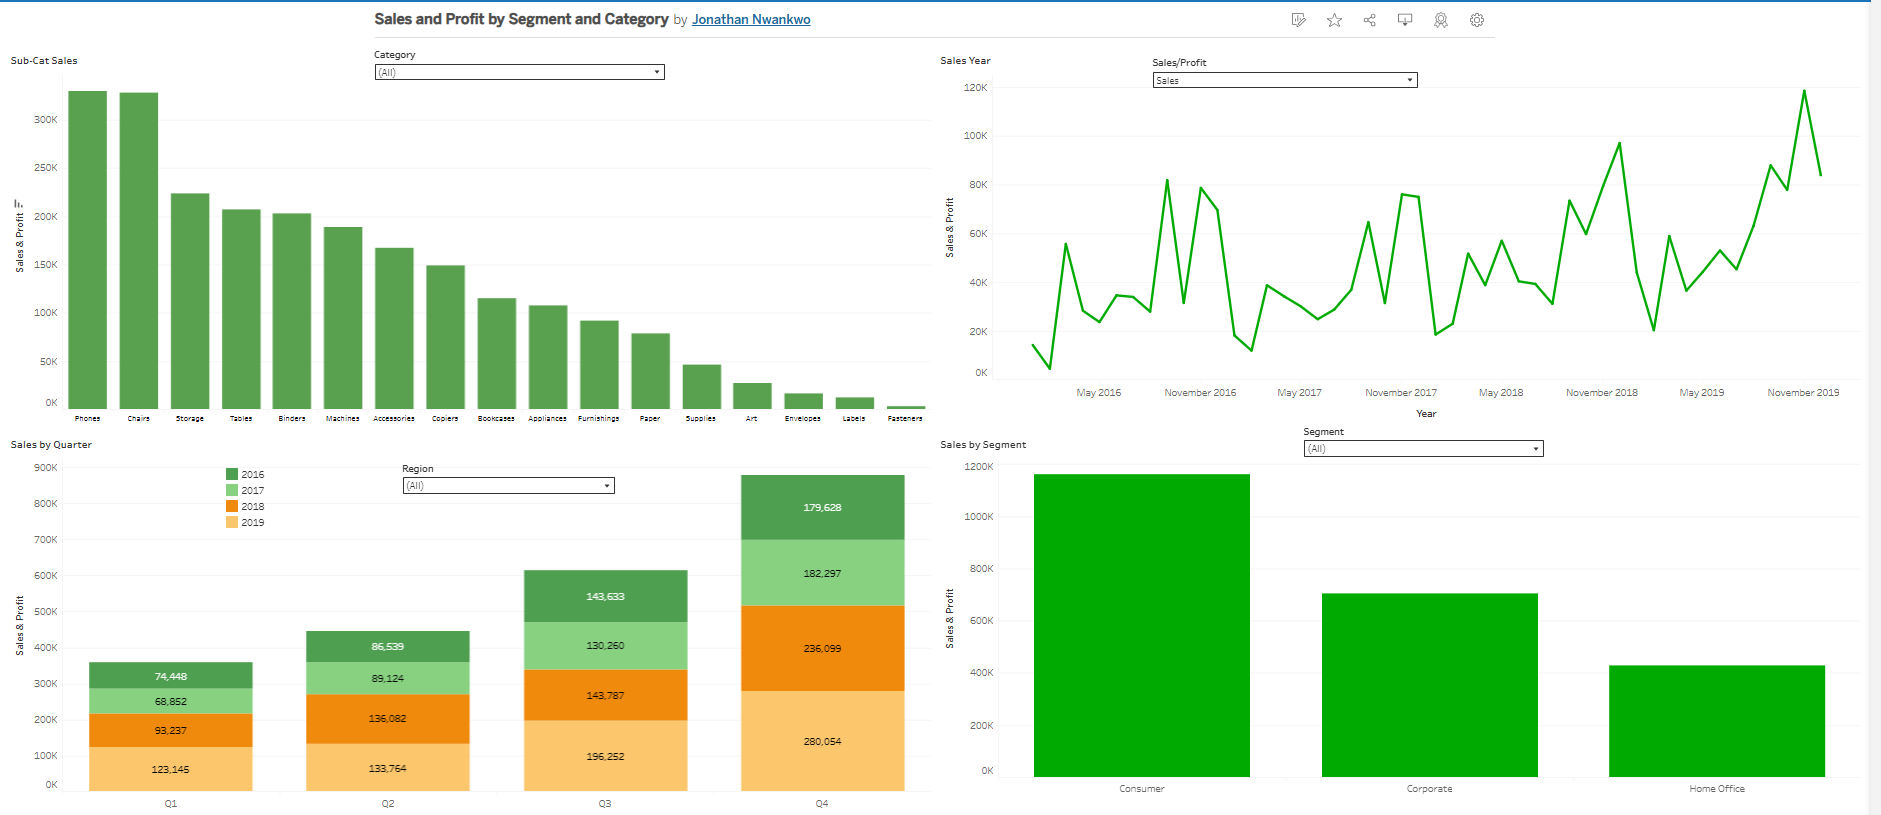
Sales and Profit Storyboard by Segment and CategoryTools: Tableau, Excel Skills Demonstrated: Data Analysis, Data Visualization, KPI Tracking, Business IntelligenceSituationThe organization needed a clear, data-driven way to track sales and profit trends over time, identify top-performing products, and evaluate performance by customer segment. The existing reports were static and lacked the interactivity required for quick decision-making.TaskMy objective was to design and develop an interactive Tableau dashboard that:Highlighted sales performance by...
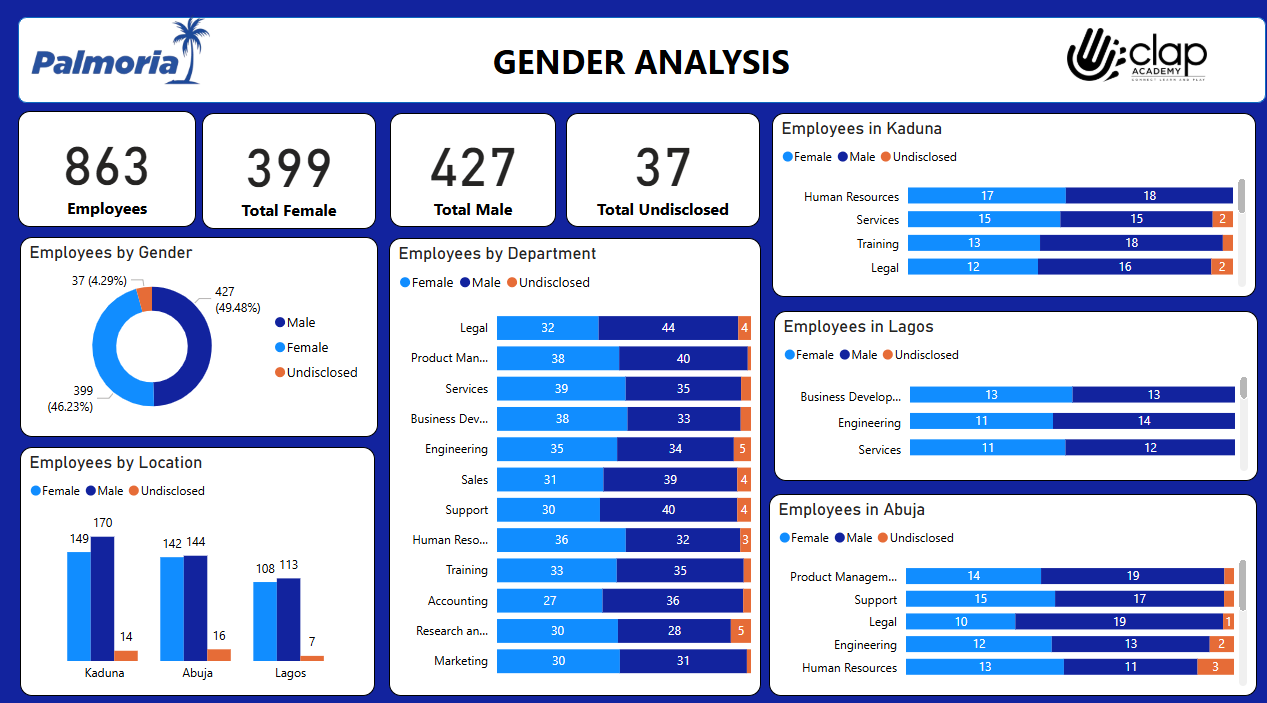
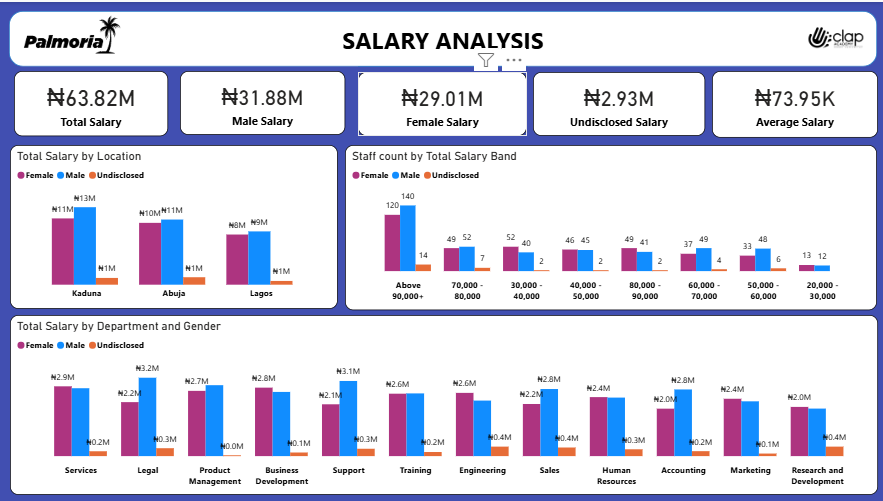
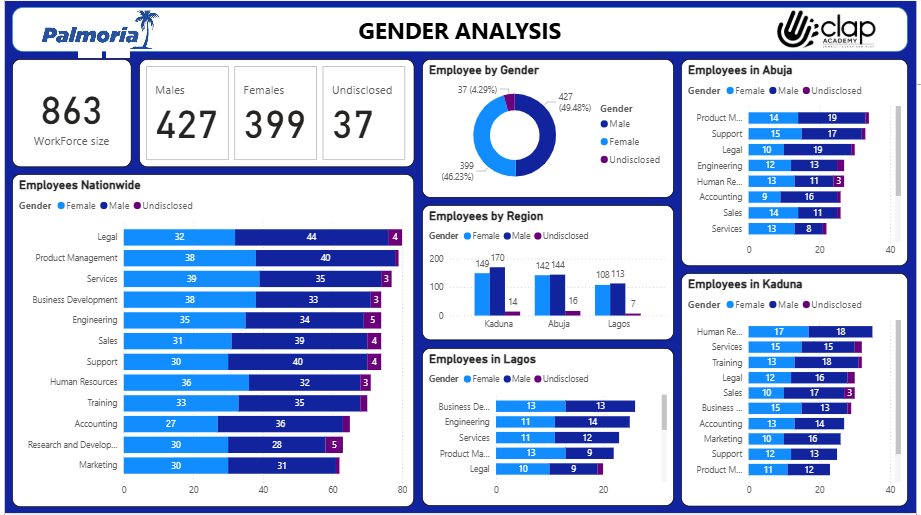
BackgroundPalmoria Group, a Nigerian manufacturing company is facing gender inequality issues in its 3 regions. A recent media report has labelled the company 'Palmoria, the Manfacturing Patriarchy' that threatens its expansion. The CEO, Mr. Ayodeji Chukwuma has asked the HR team, led by Chief Human Resources Officer Yunus Shofowole to address these issues. The Palm Project group 2025 have been tasked to analyze data and recommend solutions.Key Business QuestionsDoes gender...

This report, presents the key drivers behind our sales growth in 2022. This analysis will help us understand where our growth is coming from, focusing on specific products, states, regions, and types of locations.Sales Growth by Product:Products that significantly contributed to our sales growth in 2022:Computers showed remarkable growth, increasing from 1.3M in 2021 to 2.0M in 2022.Dinnerware also experienced substantial growth, from 1.1M to 1.8M.Other categories such as Candles,...

The report highlights:Total Crime Counts: Key metrics such as 11.36M robberies, 1M homicides, 12.42M assaults, and 1.18M rapes over the 40-year period. Violent crimes collectively accounted for 84M incidents.10-Year Trends: Crimes are broken down by decade, allowing a comparison of trends over four distinct periods (1975-1985, 1985-1995, 1995-2005, 2005-2015).Crime per Capita: Provides insights into crime rates per capita, showing fluctuations in incidents such as robberies, homicides, and assaults in proportion...
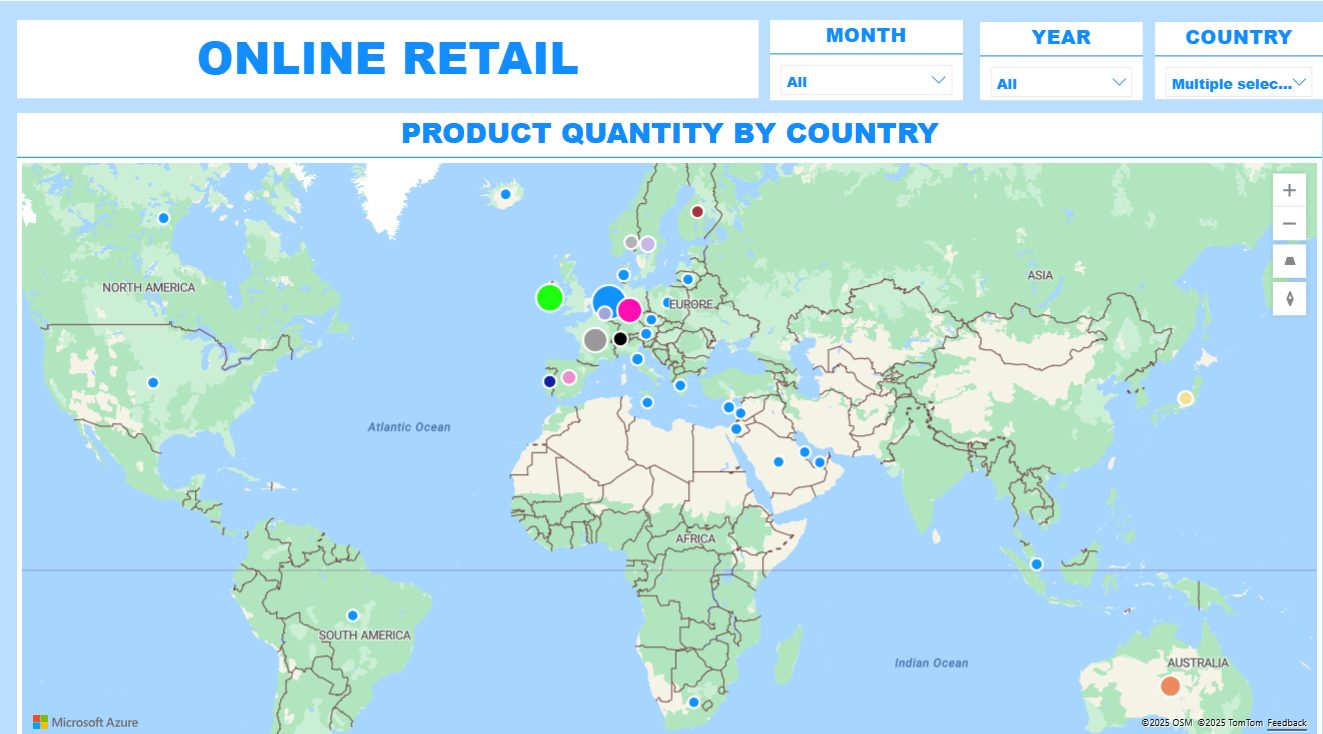
Online Retail Sales Analysis Dashboard Situation An online retail company needed deeper insights into global sales performance to identify revenue trends, top-performing markets, and high-value customers. Existing reports were static, time-consuming to generate, and lacked actionable geographic and customer segmentation views.Task Design and develop an interactive sales analytics dashboard that enables management to:Track revenue trends over time.Compare revenue vs. quantity sold by country.Identify top customers by revenue.Visualize global product distribution.ActionCollected,...
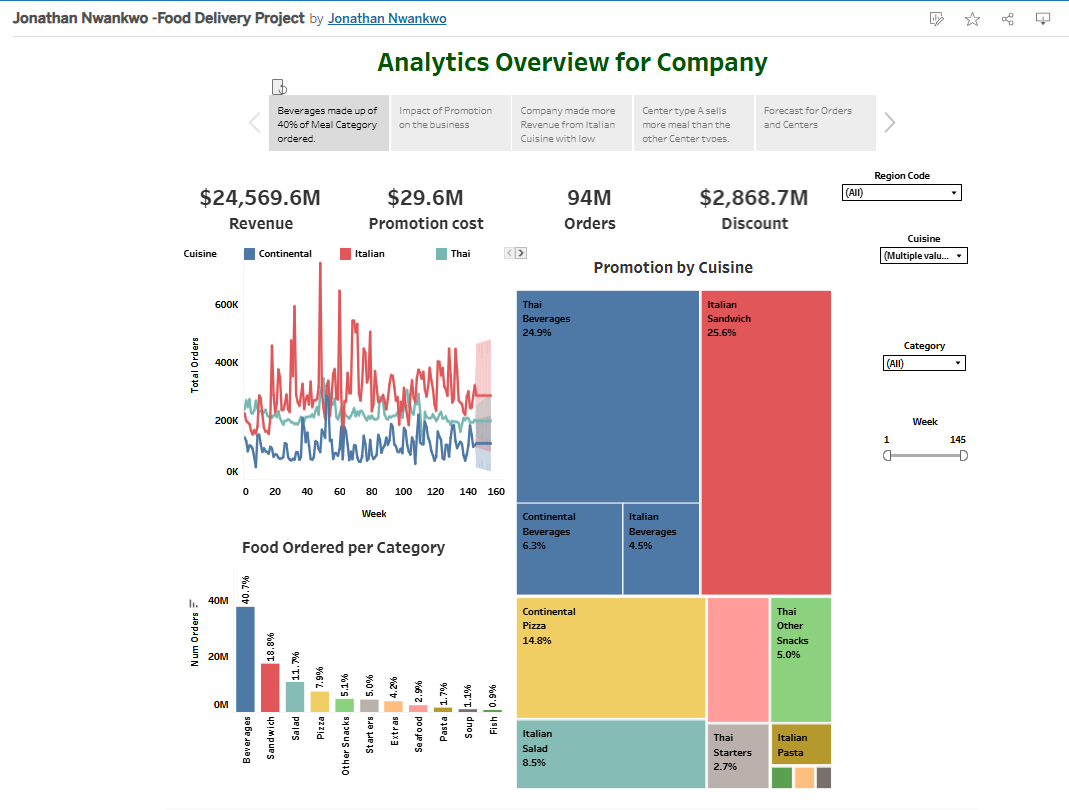
Analytics Overview for Company — Food Delivery Performance DashboardTools: Tableau, Excel Skills Demonstrated: Data Visualization, Sales Analysis, Promotional ROI Analysis, KPI ReportingSituationThe company wanted a clear, data-driven view of its food delivery business performance. Leadership needed to understand the relationship between sales, promotions, and customer ordering patterns across different cuisines and categories to guide marketing spend, product focus, and operational decisions.TaskDesign an interactive dashboard that:Consolidates revenue, promotion cost, discount, and...
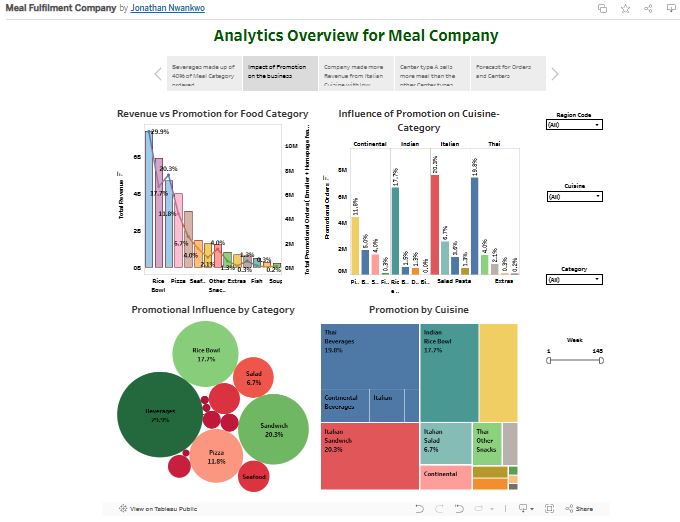
Promotional Impact Analysis — Food Category & Cuisine PerformanceTools: Tableau, Excel Skills Demonstrated: Marketing ROI Analysis, Data Visualization, Category Performance Tracking, Business IntelligenceSituationThe marketing team needed a clear, data-driven way to measure the impact of promotions on sales performance across different food categories and cuisines. Existing reports lacked the granularity to identify which product segments delivered the highest return on promotional spend, making it difficult to optimize marketing budgets.TaskDevelop an...
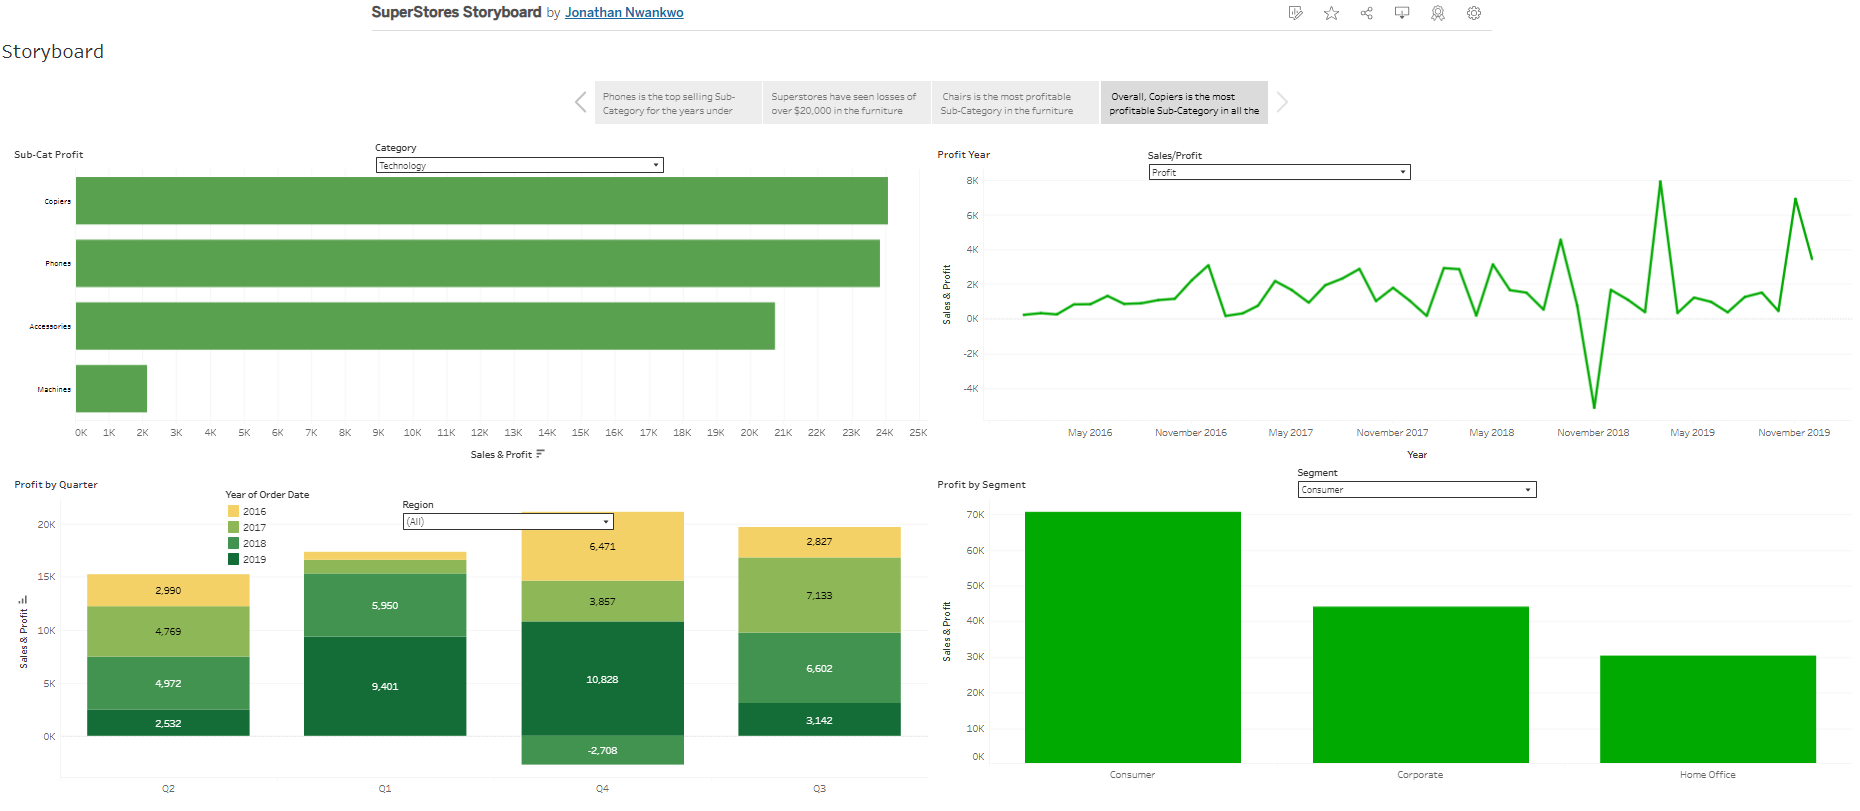
SuperStores Storyboard — Profit Analysis for Technology CategoryTools: Tableau, Excel Skills Demonstrated: Data Visualization, Profitability Analysis, Time Series Analysis, Segment Performance TrackingSituationThe business needed to evaluate profitability trends within its Technology category across different product sub-categories, time periods, and customer segments. Leadership required a tool to identify profit drivers, detect performance issues, and support strategic product and segment planning.TaskDevelop an interactive Tableau dashboard that:Breaks down profit by sub-category (Copiers, Phones,...
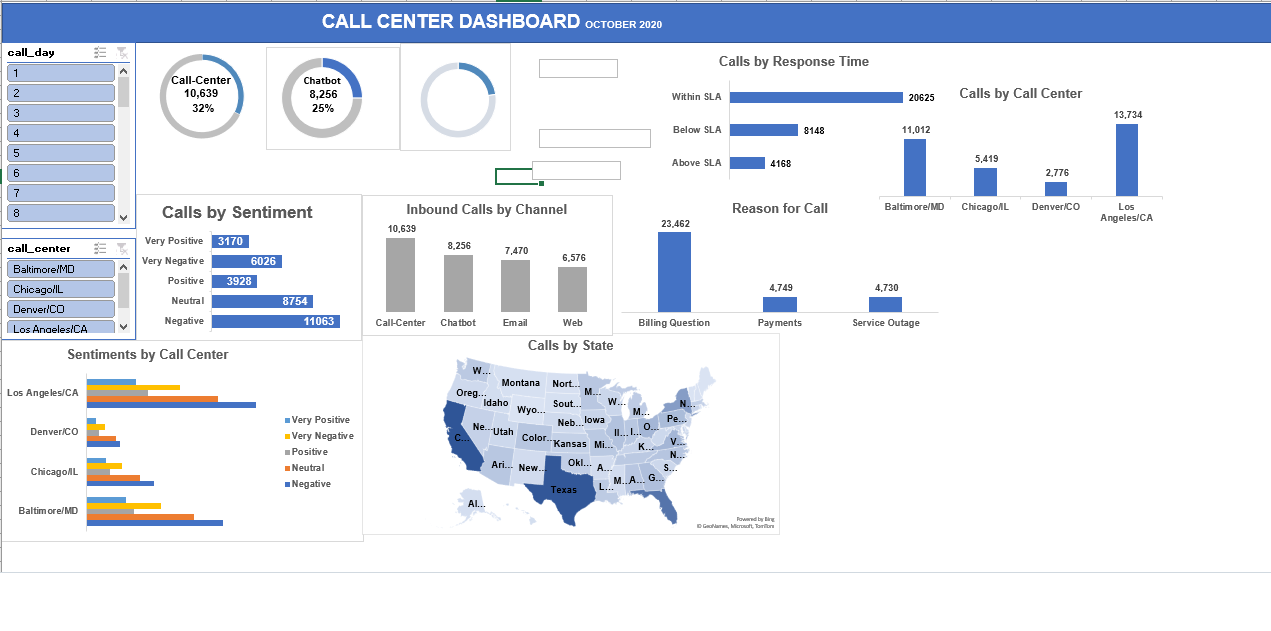
Call Center Dashboard — Customer Service Performance AnalysisTools: Power BI (or Excel Dashboard), Data Visualization, Sentiment Analysis Skills Demonstrated: KPI Tracking, Service Performance Analysis, Customer Experience InsightsSituationThe customer service department needed a centralized, visual tool to monitor call volumes, sentiment trends, and service performance across multiple channels and call centers. Leadership wanted to identify service bottlenecks, improve response times, and address recurring customer issues.TaskDevelop an interactive call center dashboard that:Consolidates...

This series of reports provides an extensive analysis of employee demographics, exit trends, and salary data across departments, states, and job types. It offers valuable insights into workforce composition, attrition reasons, and compensation structures, empowering HR and management to make informed decisions.Objective of the AnalysisThe objective of this analysis was to provide a comprehensive view of workforce composition, attrition trends, and salary distribution within the organization. By examining employee data...

Overview of Air Canada Express Customer Feedback AnalysisThis comprehensive analysis of Air Canada Express customer feedback covers multiple aspects of the customer journey, from pre-flight experiences to in-flight services. It evaluates customer satisfaction, travel preferences, demographics, and feedback on various services, providing valuable insights to enhance the customer experience.Key highlights from the data:Customer Demographics and Satisfaction:Total Customers: 91K, with a nearly even split between male (45K) and female (46K) passengers.Overall...
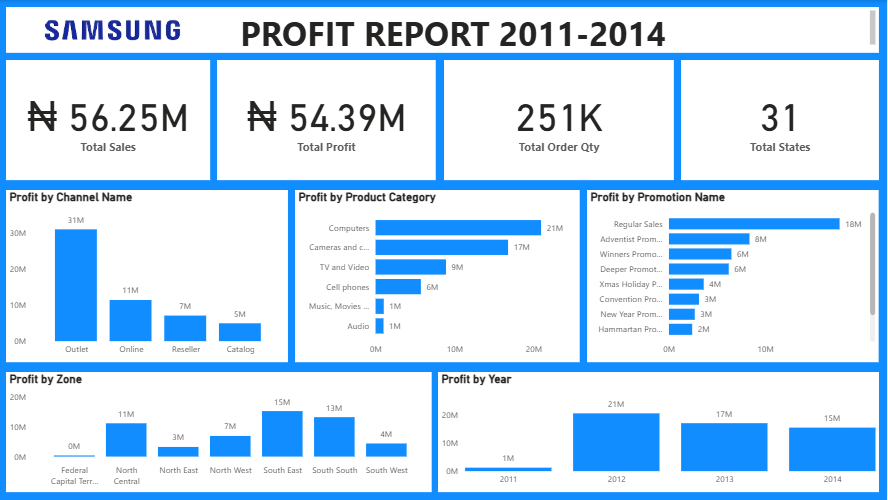
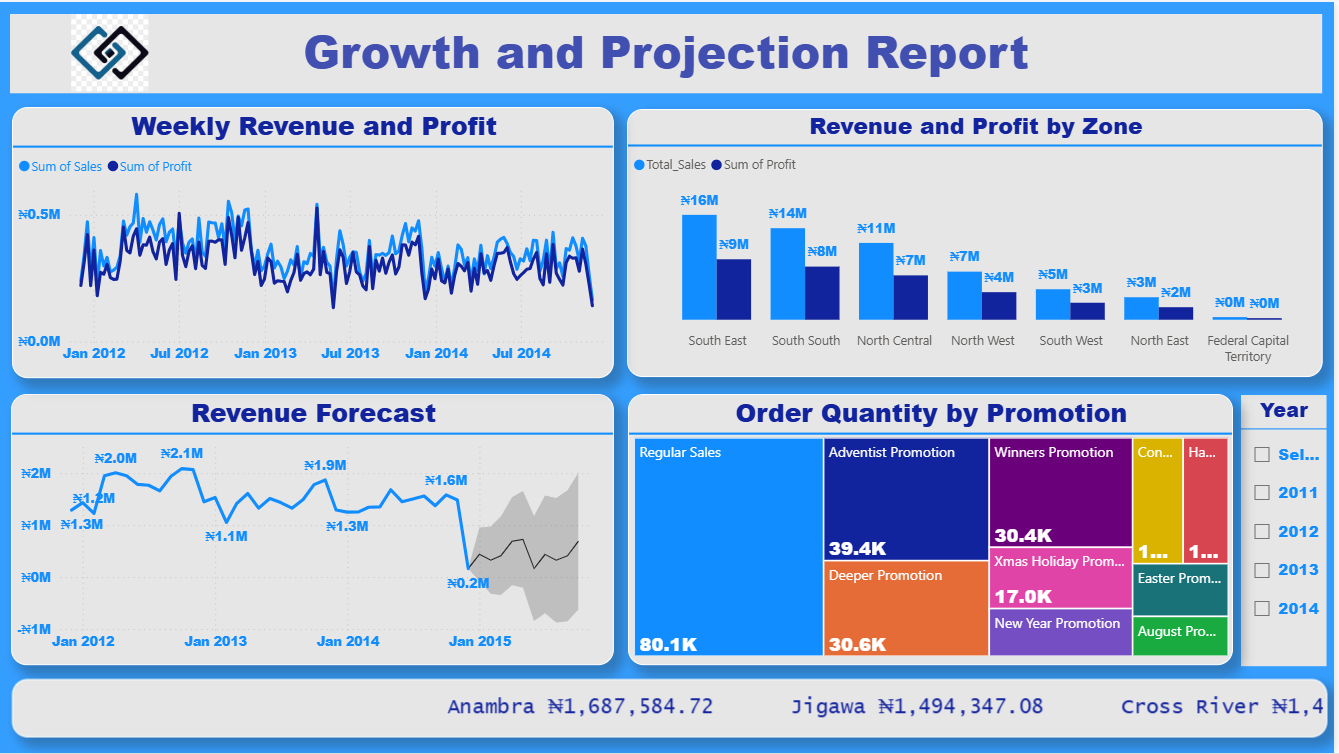
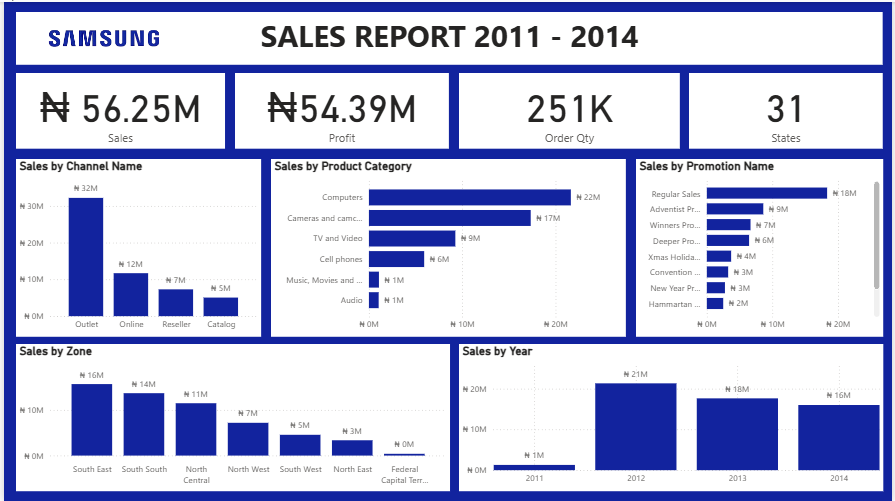
Integrated Sales, Profit & Growth Analytics Dashboard SuiteTools: Power BI, Excel Skills Demonstrated: Data Integration, Financial & Sales Performance Analysis, Forecasting, Channel & Regional Analysis, Promotion EffectivenessSituationThe company required a centralized and interactive analytics solution to monitor sales and profit trends, evaluate regional and product performance, forecast revenue, and measure the impact of promotional campaigns. Existing reports were fragmented, static, and time-consuming to compile, limiting leadership’s ability to make timely,...
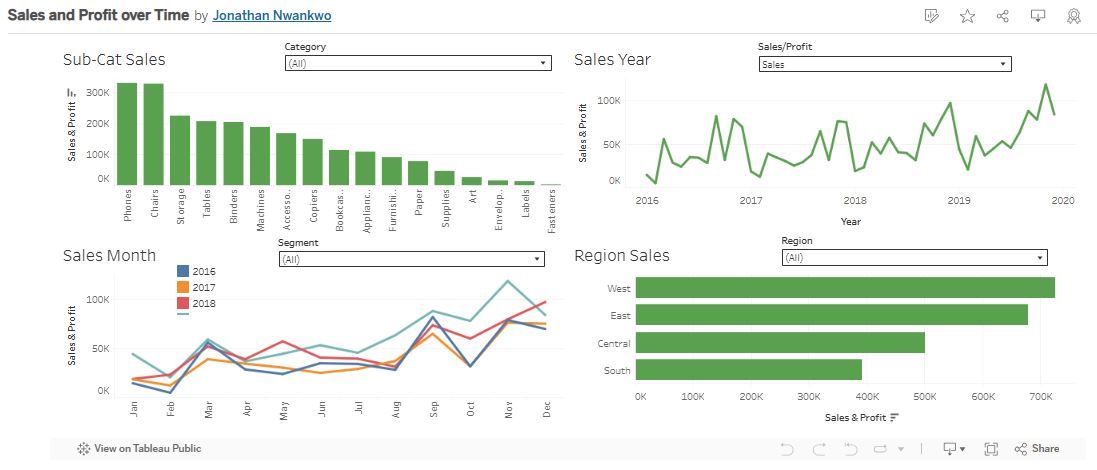
Sales and Profit over Time — Multi-Year Performance DashboardTools: Tableau, Excel Skills Demonstrated: Time Series Analysis, Regional Sales Analysis, Product Performance Tracking, Data VisualizationSituationThe sales team needed a centralized tool to monitor multi-year sales and profit trends across different product categories and regions. The objective was to identify high-performing products, uncover seasonal patterns, and optimize regional sales strategies.TaskDesign and develop an interactive Tableau dashboard that:Tracks sales and profit trends over...