Online Retail Sales Analysis Dashboard
Situation
An online retail company needed deeper insights into global sales performance to identify revenue trends, top-performing markets, and high-value customers. Existing reports were static, time-consuming to generate, and lacked actionable geographic and customer segmentation views.
Task
Design and develop an interactive sales analytics dashboard that enables management to:
- Track revenue trends over time.
- Compare revenue vs. quantity sold by country.
- Identify top customers by revenue.
- Visualize global product distribution.
Action
- Collected, cleaned, and transformed raw transactional data in Excel before importing into Power BI.
- Built multiple interactive visualizations:
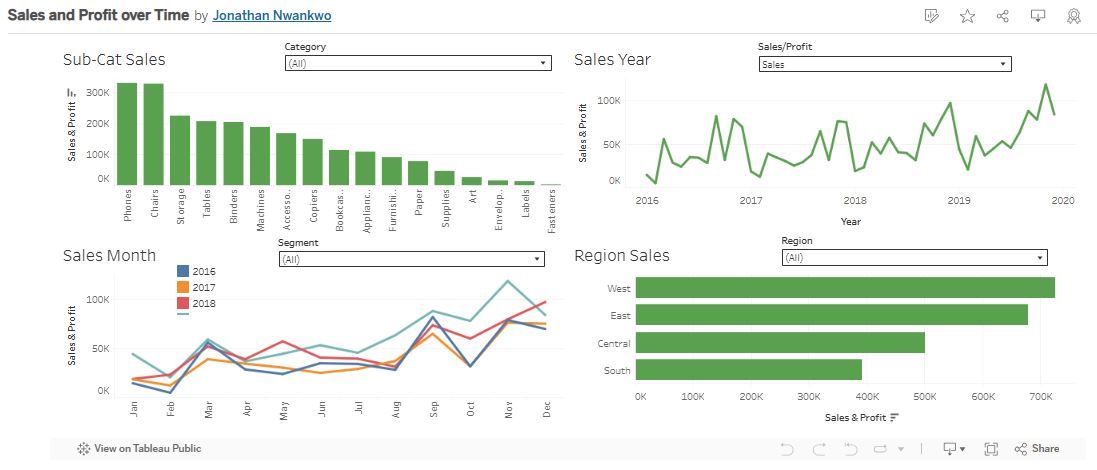
- Revenue Trend Analysis (line chart with year/month filters) to monitor seasonality.
- Revenue & Quantity by Country (dual bar chart) to compare sales volume and value.
- Top 10 Customers by Revenue (bar chart) to highlight key accounts.
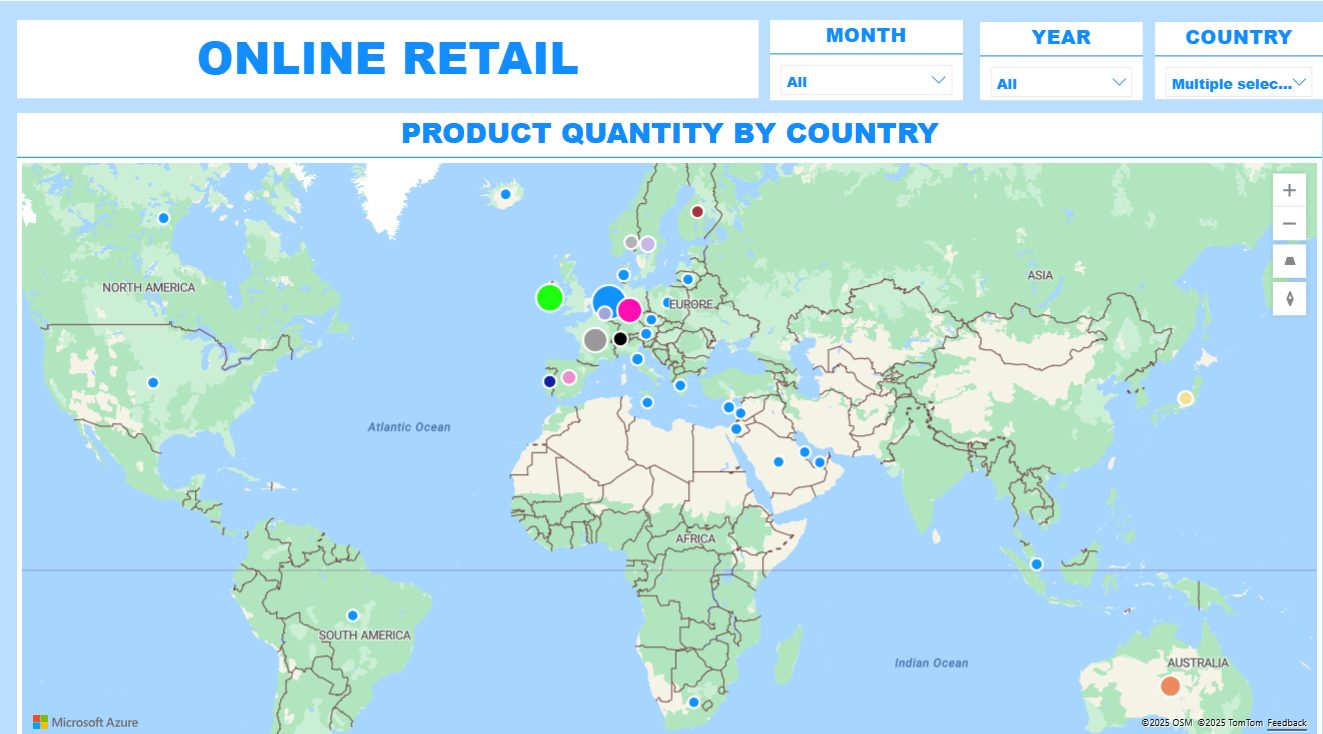
- Global Product Quantity Map to visualize geographic distribution.
- Integrated dynamic filters for Month, Year, and Country to allow multi-level analysis.
- Applied consistent visual formatting and color coding for readability and quick interpretation.
Result
- Delivered a portfolio-level dashboard used by senior leadership for ongoing performance reviews.
- Reduced manual reporting time by 60% and increased the speed of decision-making by enabling instant drill-downs.
- Helped marketing teams identify high-value accounts, resulting in a 10% increase in campaign ROI.
- Provided clear visibility into over $9M in global sales, supporting targeted expansion in top markets.


Leave a comment (0 comments)