
Jonathan Nwankwo
About
Jonathan Nwankwo — Data Analyst | Visualization Specialist I’m a data analyst passionate about turning complex datasets into clear, actionable insights that drive business growth. Skilled in SQL, Python, Excel, Power BI, and Tableau, I design interactive dashboards and visual reports that help teams identify trends, assess performance, and make informed decisions. I’ve developed impactful visual analytics for projects like the Tata Consultancy Services Data Visualization Simulation, where I created executive-ready dashboards that revealed sales growth patterns, promotional ROI, and operational opportunities. My visual storytelling skills allow me to present technical findings in a way that’s engaging, easy to understand, and directly linked to business outcomes. I specialize in data cleaning, integration, and visualization, uncovering hidden patterns, and delivering solutions that improve efficiency and profitability. Whether it’s tracking KPIs, forecasting trends, or analyzing customer behavior, I focus on providing insights that lead to measurable results.
Work Experience
Not Available
Education
Not Available
Certification
No certification available
Work Availability
Not Available
Additional links
Not Available
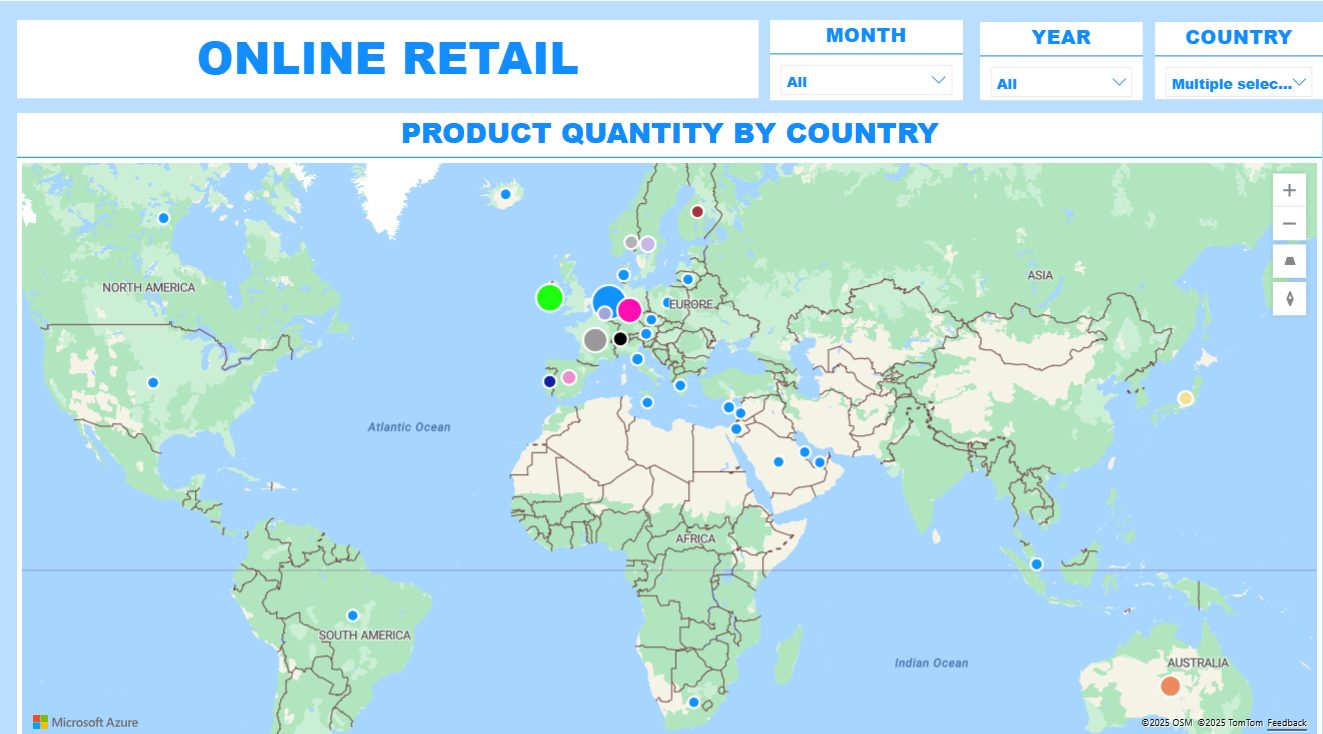
Online Retail Sales Analysis Dashboard
Online Retail Sales Analysis Dashboard Situation An online retail company needed deeper insights into global sales performance to identify revenue trends, top-performing markets, and high-value customers. Existing reports were static, time-consuming to generate, and lacked actionable geographic and customer segmentation views.Task Design and develop an interactive sales analytics dashboard that...
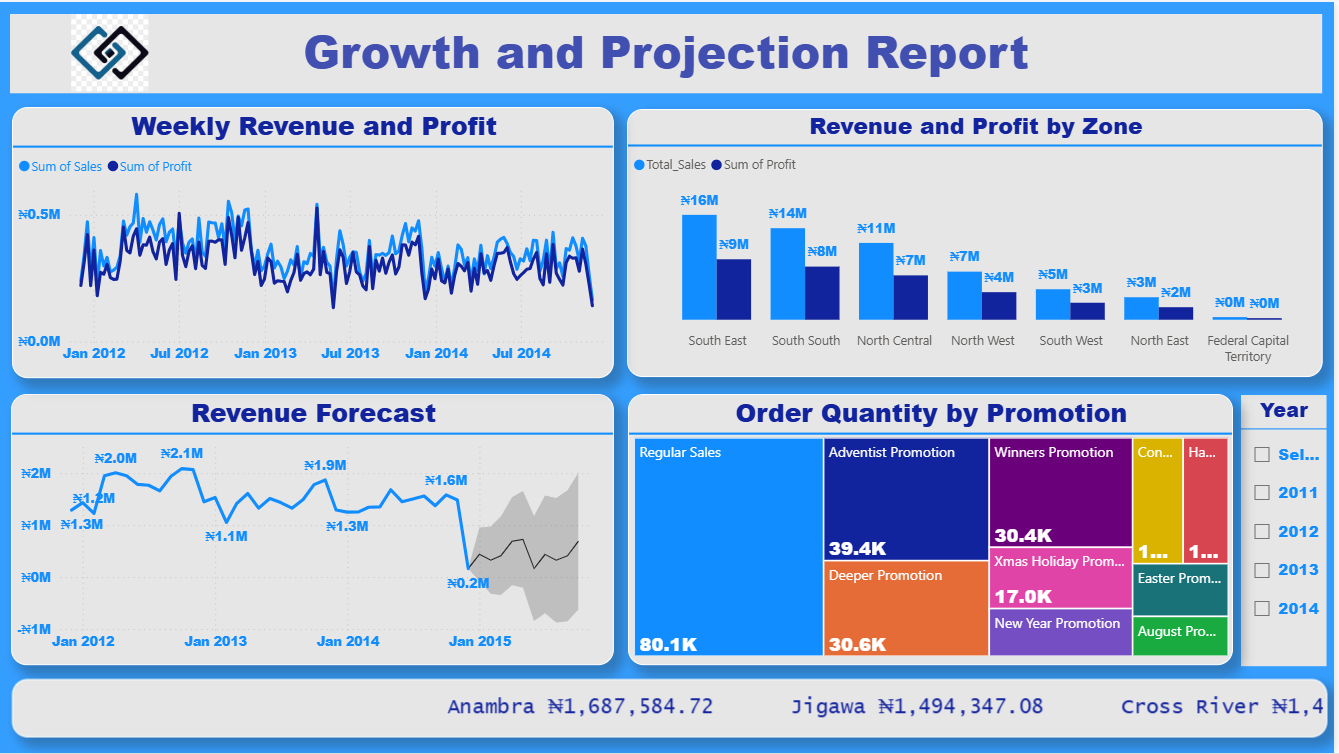
Integrated Sales, Profit & Growth Analytics Dashboard Suite
Integrated Sales, Profit & Growth Analytics Dashboard SuiteTools: Power BI, Excel Skills Demonstrated: Data Integration, Financial & Sales Performance Analysis, Forecasting, Channel & Regional Analysis, Promotion EffectivenessSituationThe company required a centralized and interactive analytics solution to monitor sales and profit trends, evaluate regional and product performance, forecast revenue, and measure...
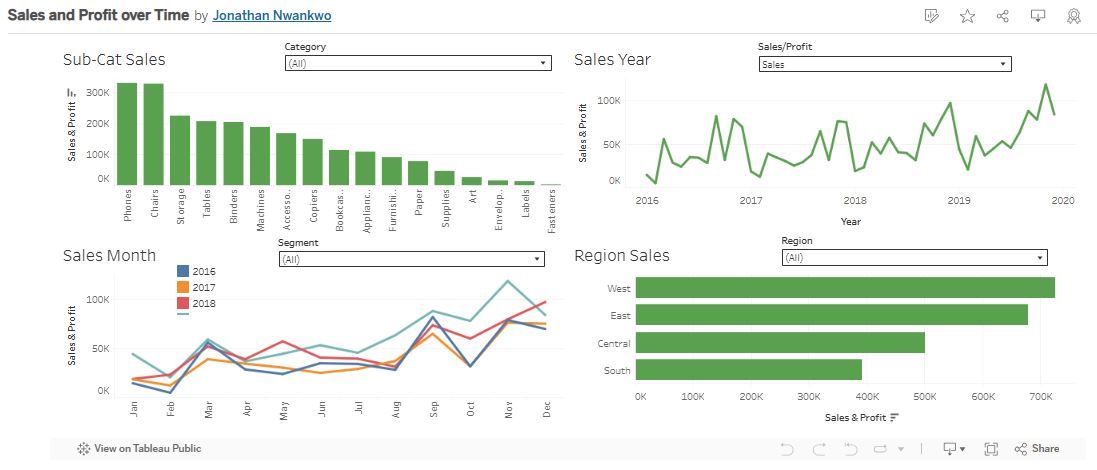
Sales and Profit over Time — Multi-Year Performance Dashboard
Sales and Profit over Time — Multi-Year Performance DashboardTools: Tableau, Excel Skills Demonstrated: Time Series Analysis, Regional Sales Analysis, Product Performance Tracking, Data VisualizationSituationThe sales team needed a centralized tool to monitor multi-year sales and profit trends across different product categories and regions. The objective was to identify high-performing products,...
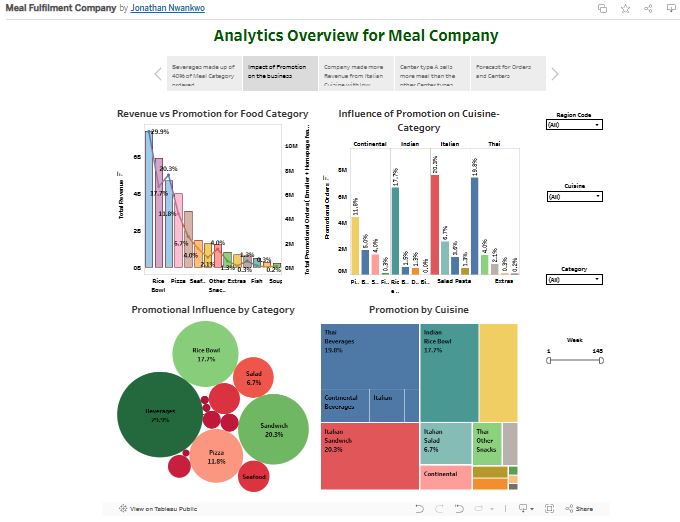
Promotional Impact Analysis for a Food Company
Promotional Impact Analysis — Food Category & Cuisine PerformanceTools: Tableau, Excel Skills Demonstrated: Marketing ROI Analysis, Data Visualization, Category Performance Tracking, Business IntelligenceSituationThe marketing team needed a clear, data-driven way to measure the impact of promotions on sales performance across different food categories and cuisines. Existing reports lacked the granularity...
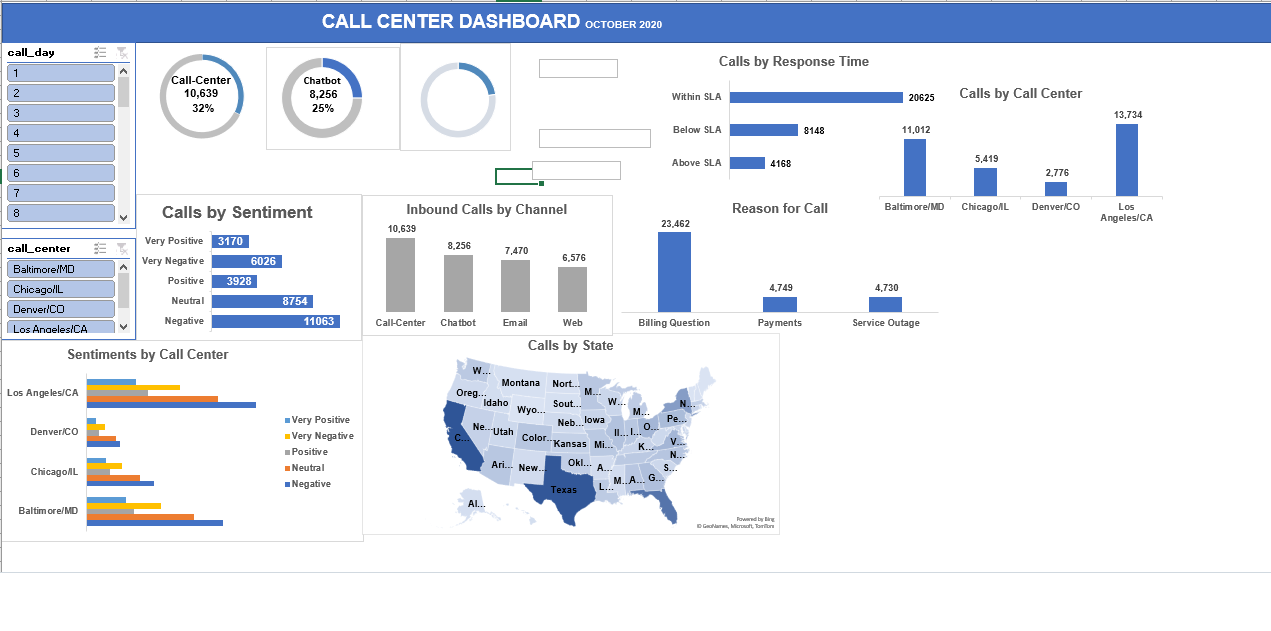
Call Center Dashboard — Customer Service Performance Analysis
Call Center Dashboard — Customer Service Performance AnalysisTools: Power BI (or Excel Dashboard), Data Visualization, Sentiment Analysis Skills Demonstrated: KPI Tracking, Service Performance Analysis, Customer Experience InsightsSituationThe customer service department needed a centralized, visual tool to monitor call volumes, sentiment trends, and service performance across multiple channels and call centers....