Promotional Impact Analysis — Food Category & Cuisine Performance
Tools: Tableau, Excel
Skills Demonstrated: Marketing ROI Analysis, Data Visualization, Category Performance Tracking, Business Intelligence
Situation
The marketing team needed a clear, data-driven way to measure the impact of promotions on sales performance across different food categories and cuisines. Existing reports lacked the granularity to identify which product segments delivered the highest return on promotional spend, making it difficult to optimize marketing budgets.
Task
Develop an interactive dashboard that:
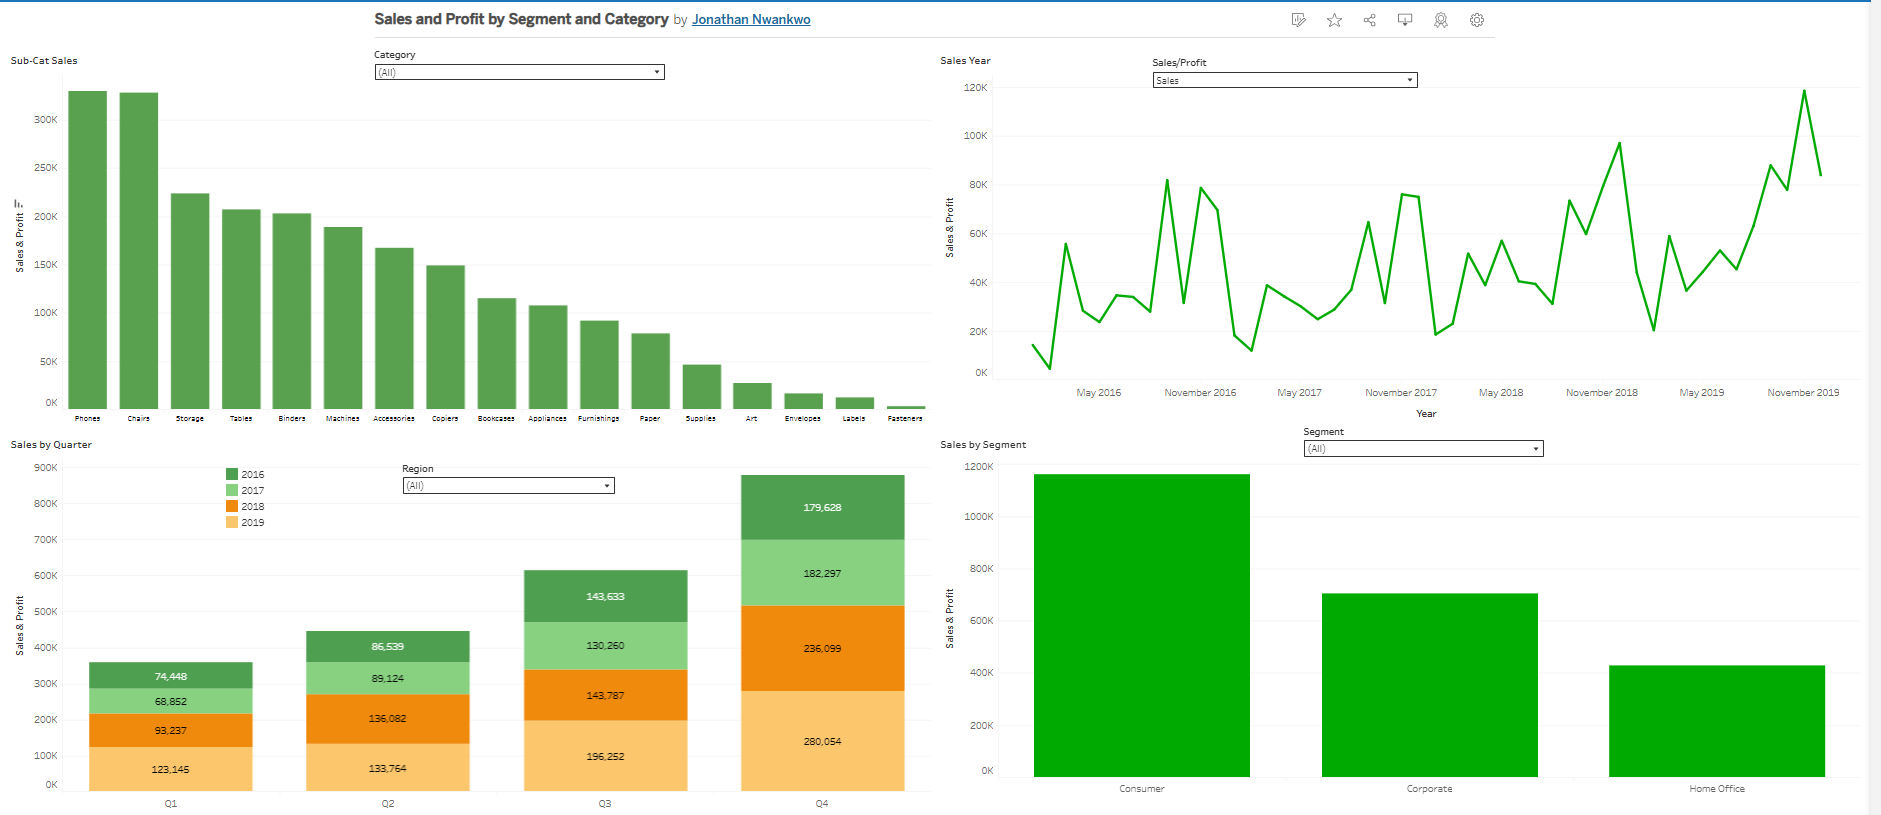
- Analyzes total revenue against promotional spend for each food category.
- Identifies which cuisines and categories are most responsive to promotions.
- Visualizes promotional influence distribution to support strategic marketing planning.
- Provides actionable insights for optimizing promotional allocation.
Action
- Data Preparation: Cleaned and merged sales, promotions, and category datasets in Excel; standardized category and cuisine naming conventions.
- Dashboard Development in Tableau:
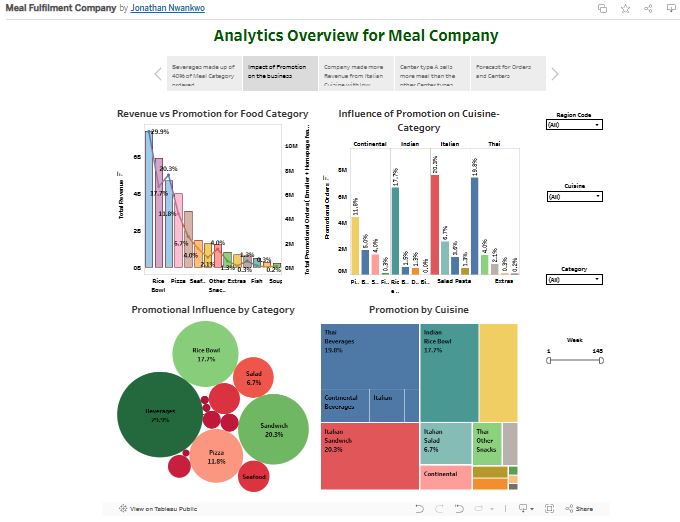
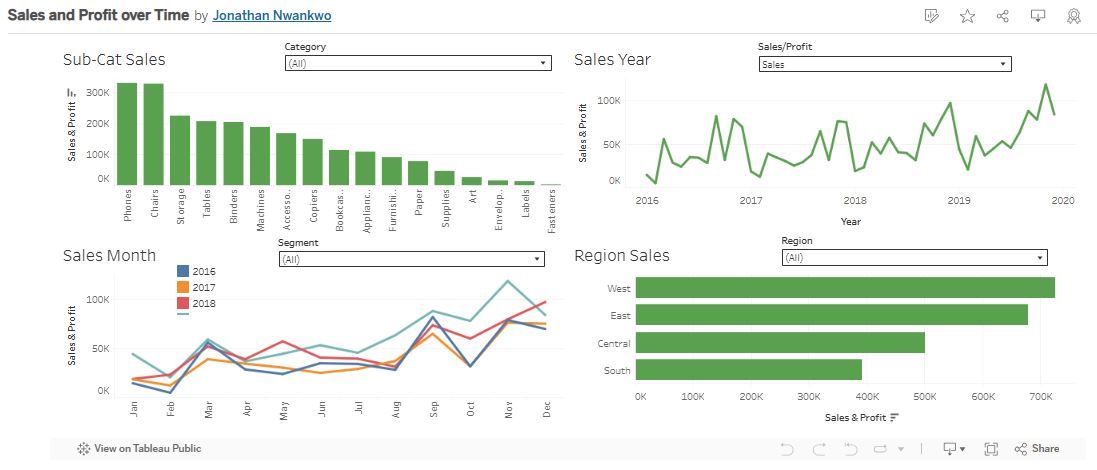
- Revenue vs Promotion Chart to compare total sales with promotional spend per category.
- Cuisine-Category Promotion Analysis to show responsiveness to promotions within each cuisine.
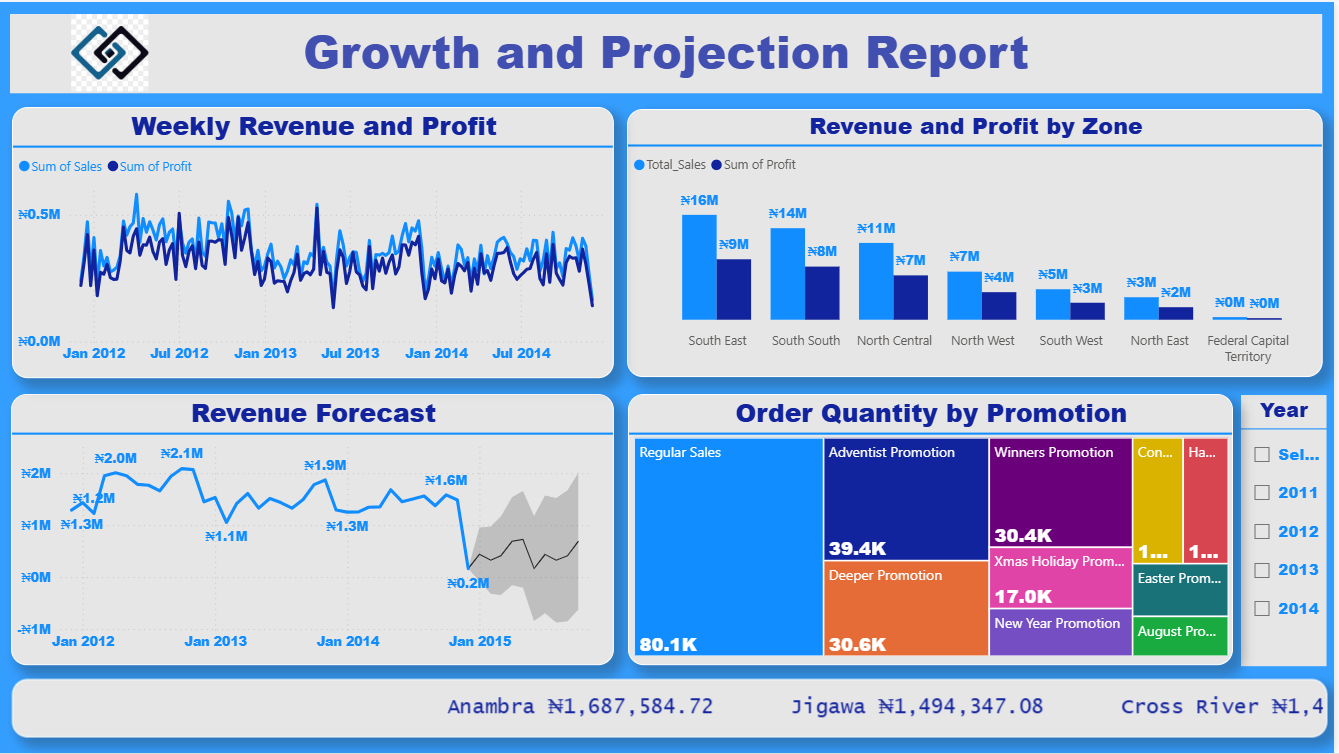
- Bubble Chart to visualize promotional influence share by category.
- Treemap to display promotion distribution across cuisines and associated categories.
- Added filters for Region, Cuisine, Category, and Week to enable targeted exploration.
- Analysis:
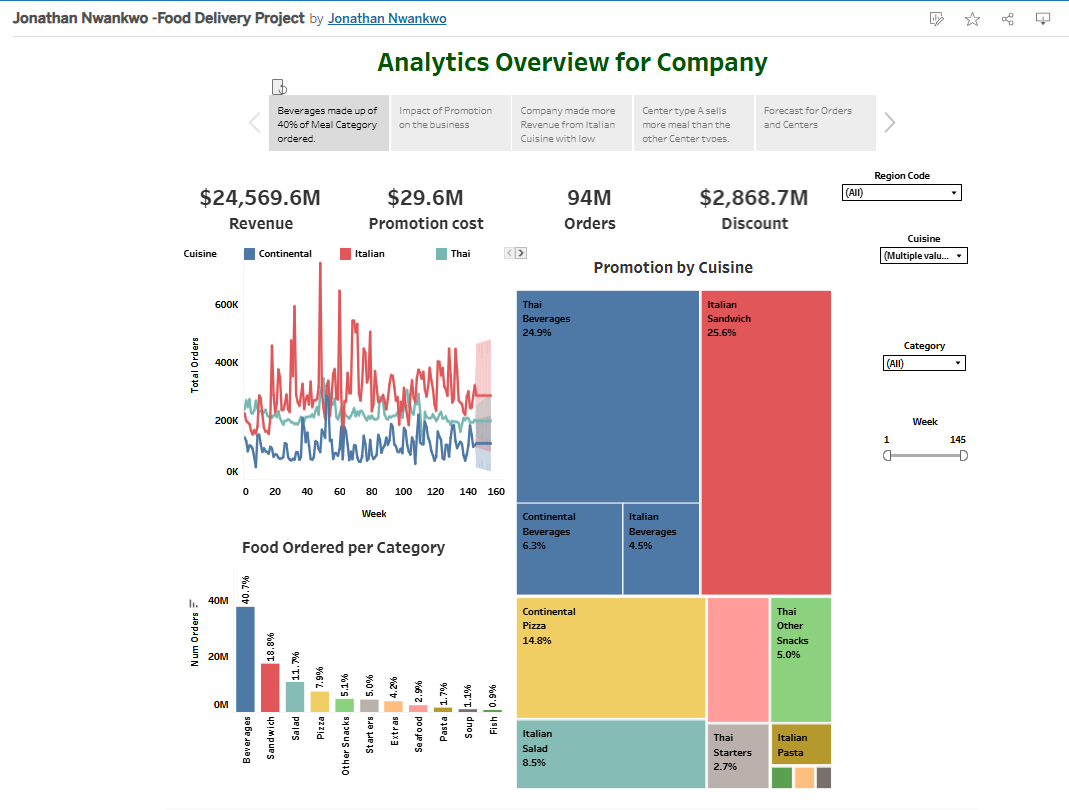
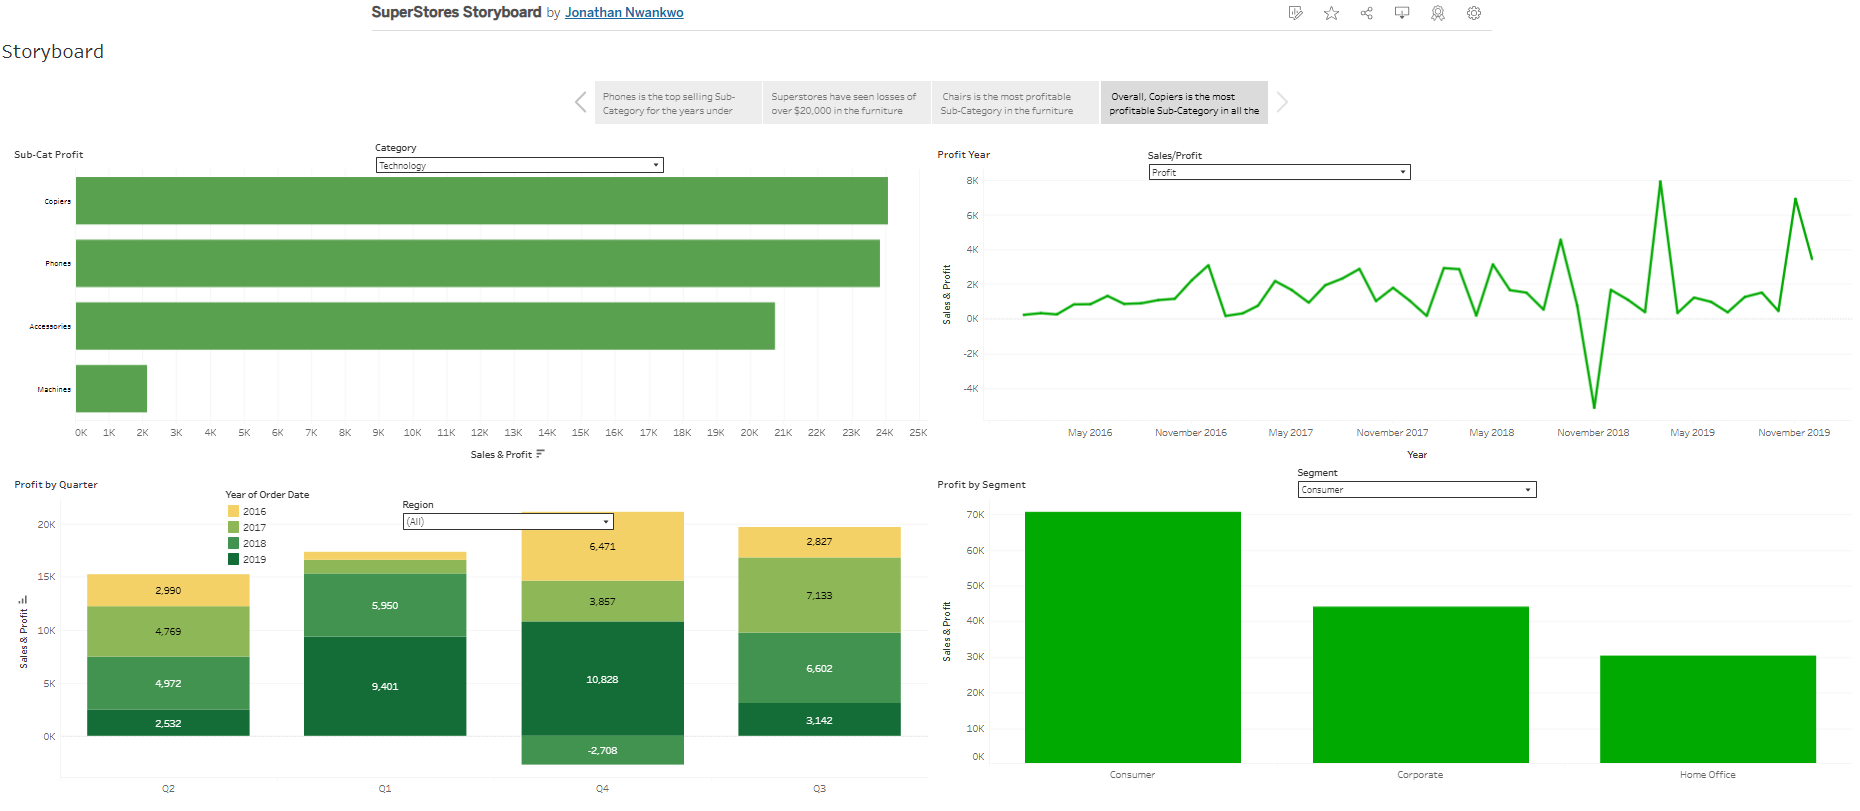
- Found that Beverages generated the highest promotional influence (21.9%) and revenue share (~29.3%).
- Identified Italian Sandwiches and Thai Beverages as the most promotion-responsive items.
- Highlighted low-performing categories like Seafood and Extras with minimal promotion share.
Result
- Delivered a visual analytics tool that reduced promotional performance reporting time by over 50%.
- Helped marketing prioritize Beverages, Sandwiches, and Rice Bowls, resulting in a more focused campaign strategy.
- Provided insights that led to the introduction of targeted promotions for underperforming categories, improving sales mix diversity.
- Enabled cuisine-specific marketing strategies, increasing promotional ROI in high-response products.
Portfolio Value: This project demonstrates my ability to use data visualization to measure marketing effectiveness, identify high-ROI opportunities, and guide promotional budget allocation for maximum impact.


Leave a comment (0 comments)