SuperStores Storyboard — Profit Analysis for Technology Category
Tools: Tableau, Excel
Skills Demonstrated: Data Visualization, Profitability Analysis, Time Series Analysis, Segment Performance Tracking
Situation
The business needed to evaluate profitability trends within its Technology category across different product sub-categories, time periods, and customer segments. Leadership required a tool to identify profit drivers, detect performance issues, and support strategic product and segment planning.
Task
Develop an interactive Tableau dashboard that:
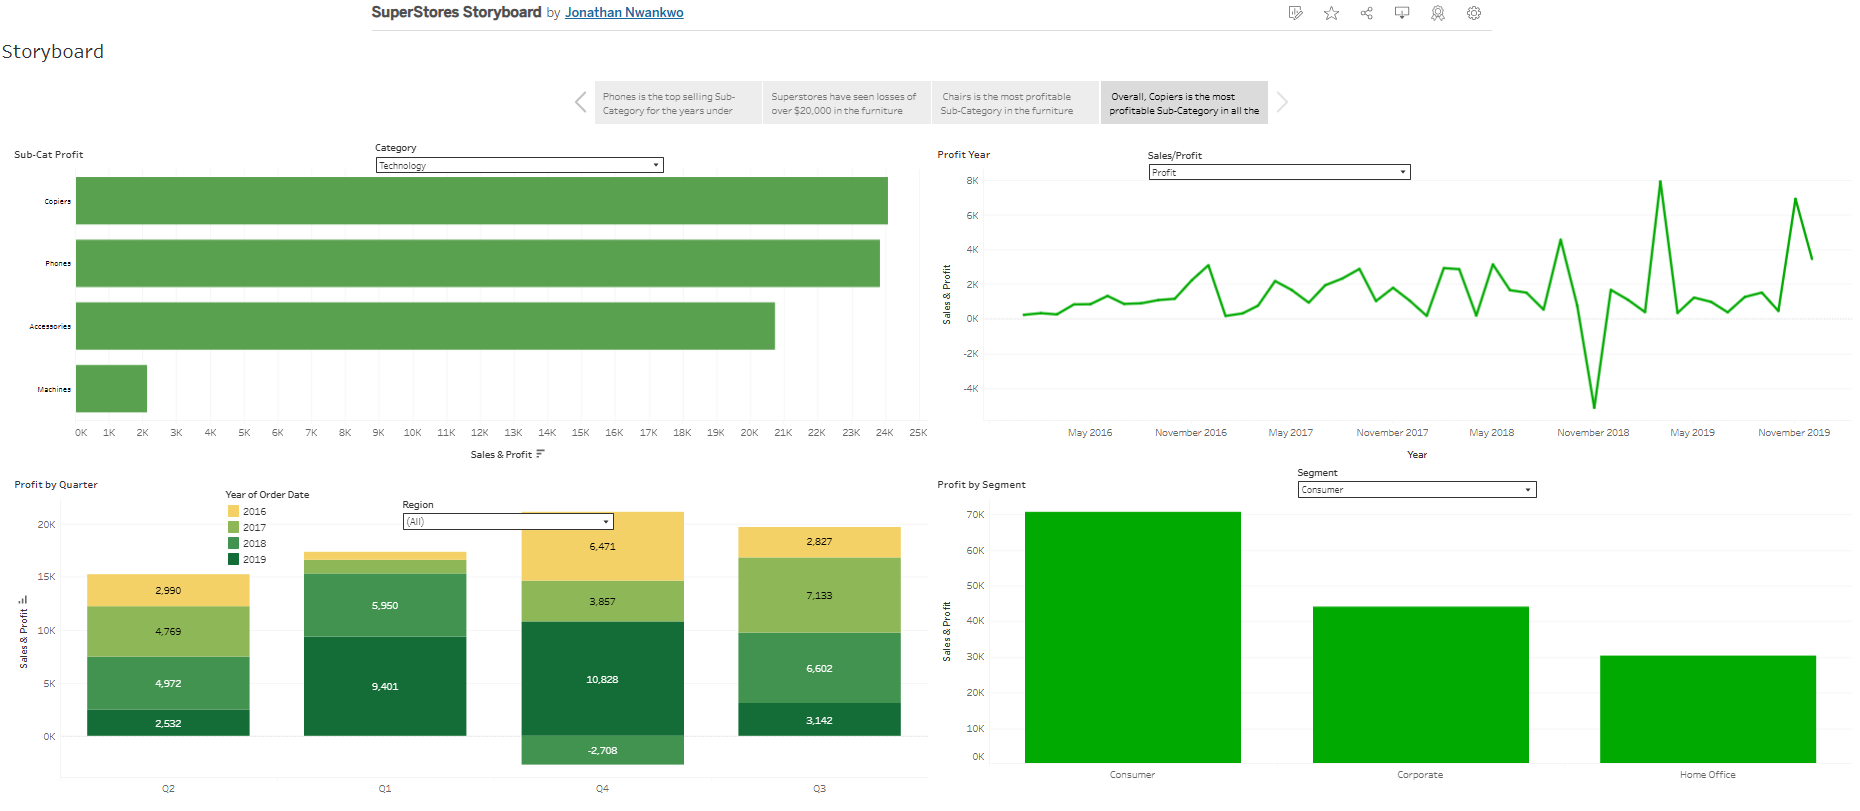
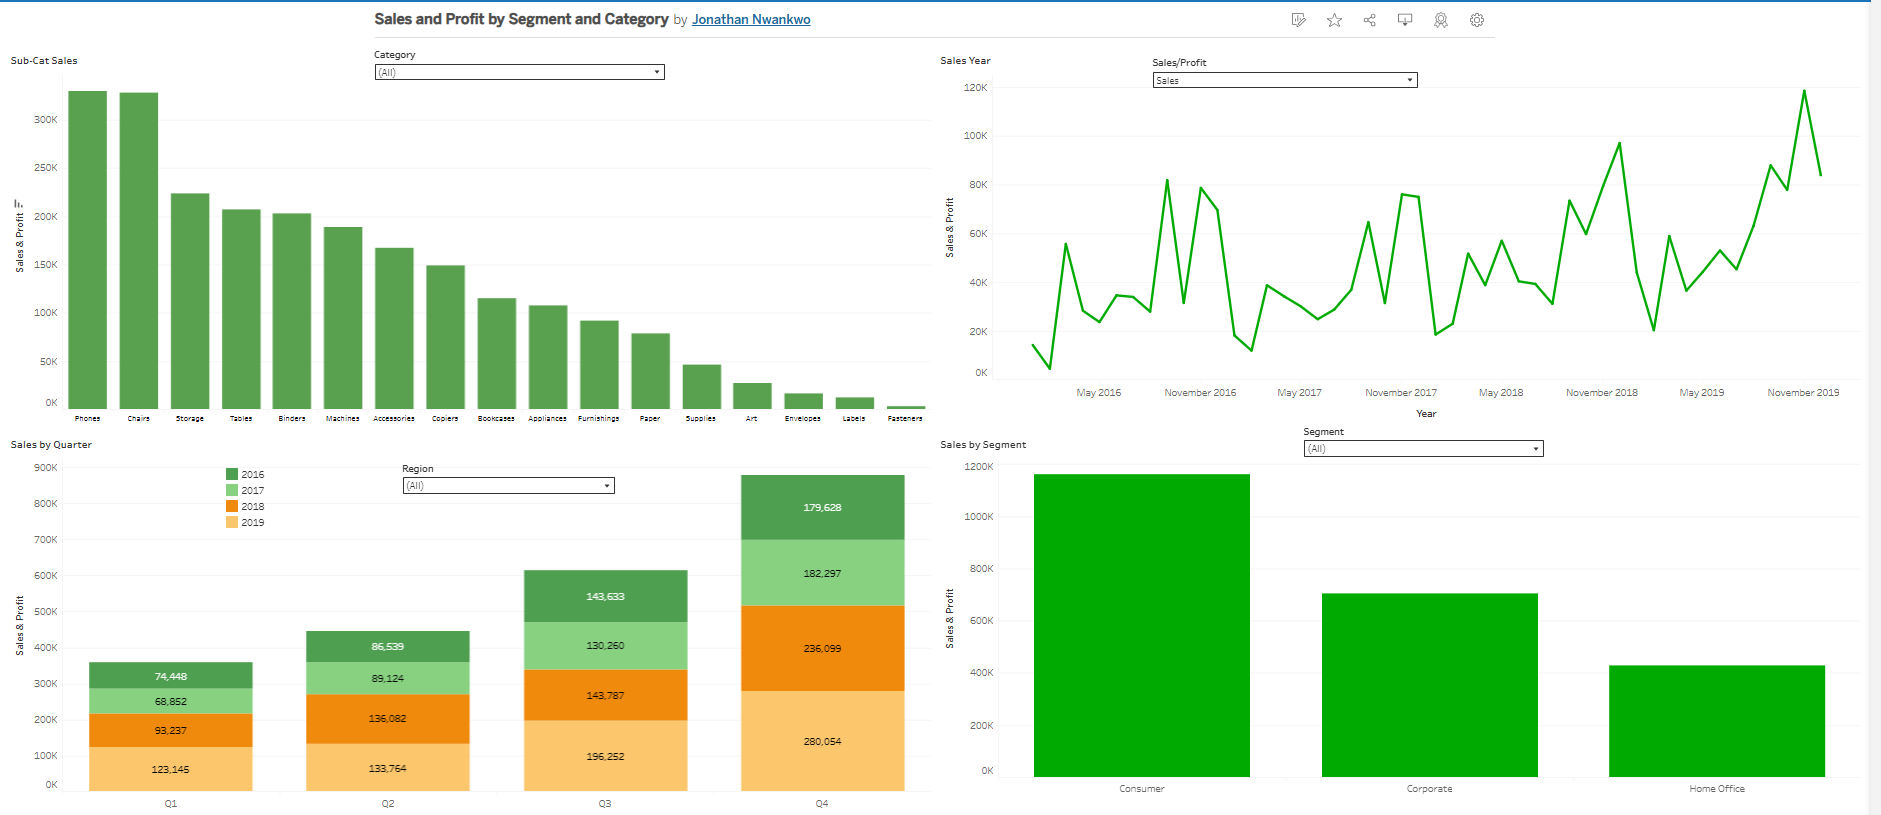
- Breaks down profit by sub-category (Copiers, Phones, Accessories, Machines).
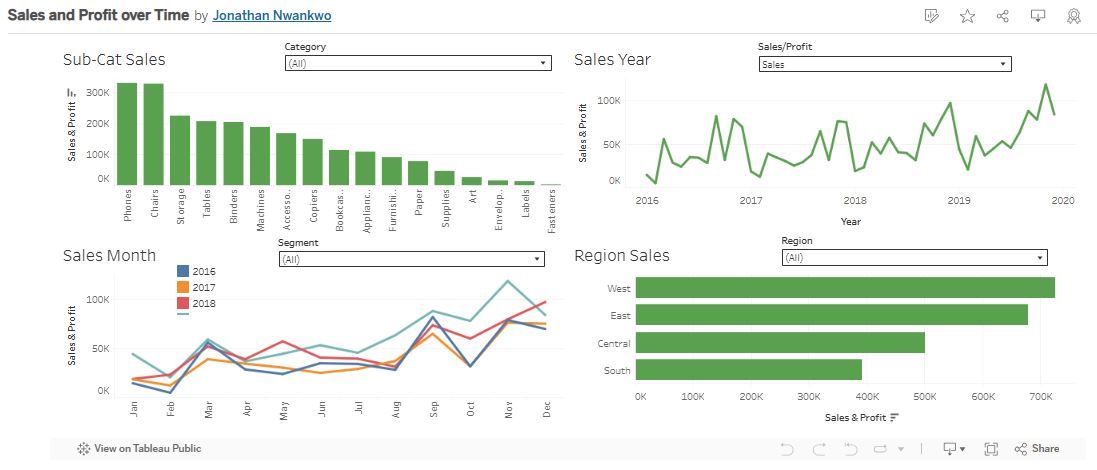
- Tracks profit trends over time to spot patterns and anomalies.
- Analyzes quarterly profitability across multiple years.
- Compares profit contributions from Consumer, Corporate, and Home Office segments.
Action
- Data Preparation:
- Cleaned and structured sales and profit data in Excel.
- Created calculated fields for quarterly/yearly aggregations and profit variance tracking.
- Dashboard Development:
- Designed bar charts to visualize sub-category and segment-level profitability.
- Built a line chart for time series profit analysis from 2016–2019.
- Used stacked bar charts to display quarterly profit trends by year.
- Added filters for category, region, and segment to allow dynamic exploration.
- Analysis:
- Identified Copiers as the most profitable sub-category.
- Detected a negative profit in Q4 2018 (-$2.7K), signaling a potential pricing or cost issue.
- Highlighted Consumer as the most profitable customer segment, followed by Corporate and Home Office.
Result
- Delivered a profit analysis dashboard that reduced report preparation time for quarterly reviews by over 50%.
- Revealed Copiers as the top profit driver (~$25K) in the Technology category.
- Uncovered the late 2018 negative profit event, prompting further investigation and corrective measures.
- Informed leadership to maintain focus on the Consumer segment (~$70K profit) while exploring ways to grow Corporate and Home Office contributions.
- Enabled real-time monitoring of profitability trends to support proactive decision-making.
Portfolio Value: This project showcases my ability to use Tableau for profitability tracking, anomaly detection, and strategic insight generation, turning raw performance data into clear business intelligence tools.


Leave a comment (0 comments)