Integrated Sales, Profit & Growth Analytics Dashboard Suite
Tools: Power BI, Excel
Skills Demonstrated: Data Integration, Financial & Sales Performance Analysis, Forecasting, Channel & Regional Analysis, Promotion Effectiveness
Situation
The company required a centralized and interactive analytics solution to monitor sales and profit trends, evaluate regional and product performance, forecast revenue, and measure the impact of promotional campaigns. Existing reports were fragmented, static, and time-consuming to compile, limiting leadership’s ability to make timely, data-driven decisions.
Task
Design and deliver a multi-dashboard analytics suite that:
- Consolidates sales, profit, cost, orders, and promotional data from multiple sources.
- Tracks performance over time at weekly, quarterly, and annual levels.
- Breaks down results by region, state, product category, and sales channel.
- Forecasts revenue and highlights deviations from sales/profit targets.
- Analyzes promotional campaign performance to optimize marketing investment.
Action
- Data Preparation & Integration:
- Consolidated sales, cost, profit, and promotions data into a clean, unified dataset using Excel.
- Standardized product subcategories, region/state codes, and channel labels for consistency.
- Created calculated fields for profit margin, year-over-year growth, and promotion influence metrics.
- Dashboard Development:
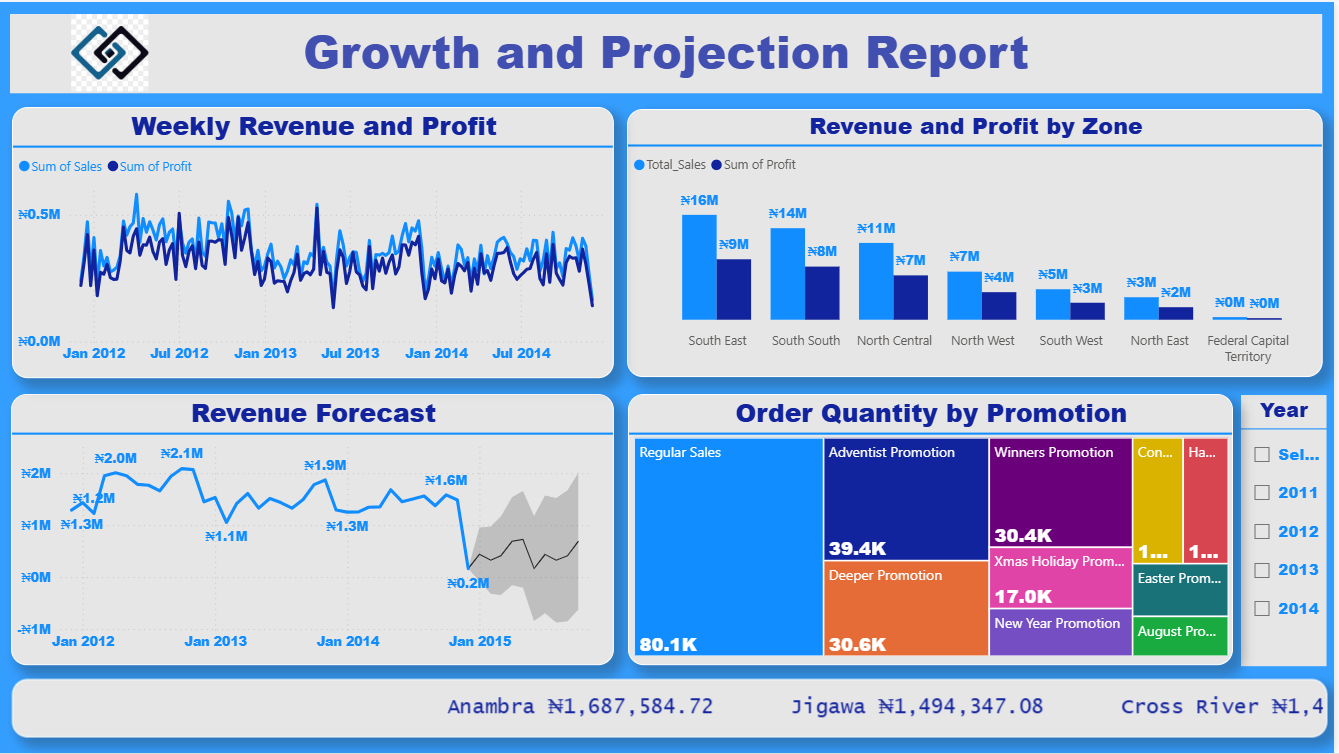
- Growth & Projection Report: Weekly sales/profit trends (2012–2014), regional breakdowns, revenue forecasting with confidence intervals, and promotional order volumes.
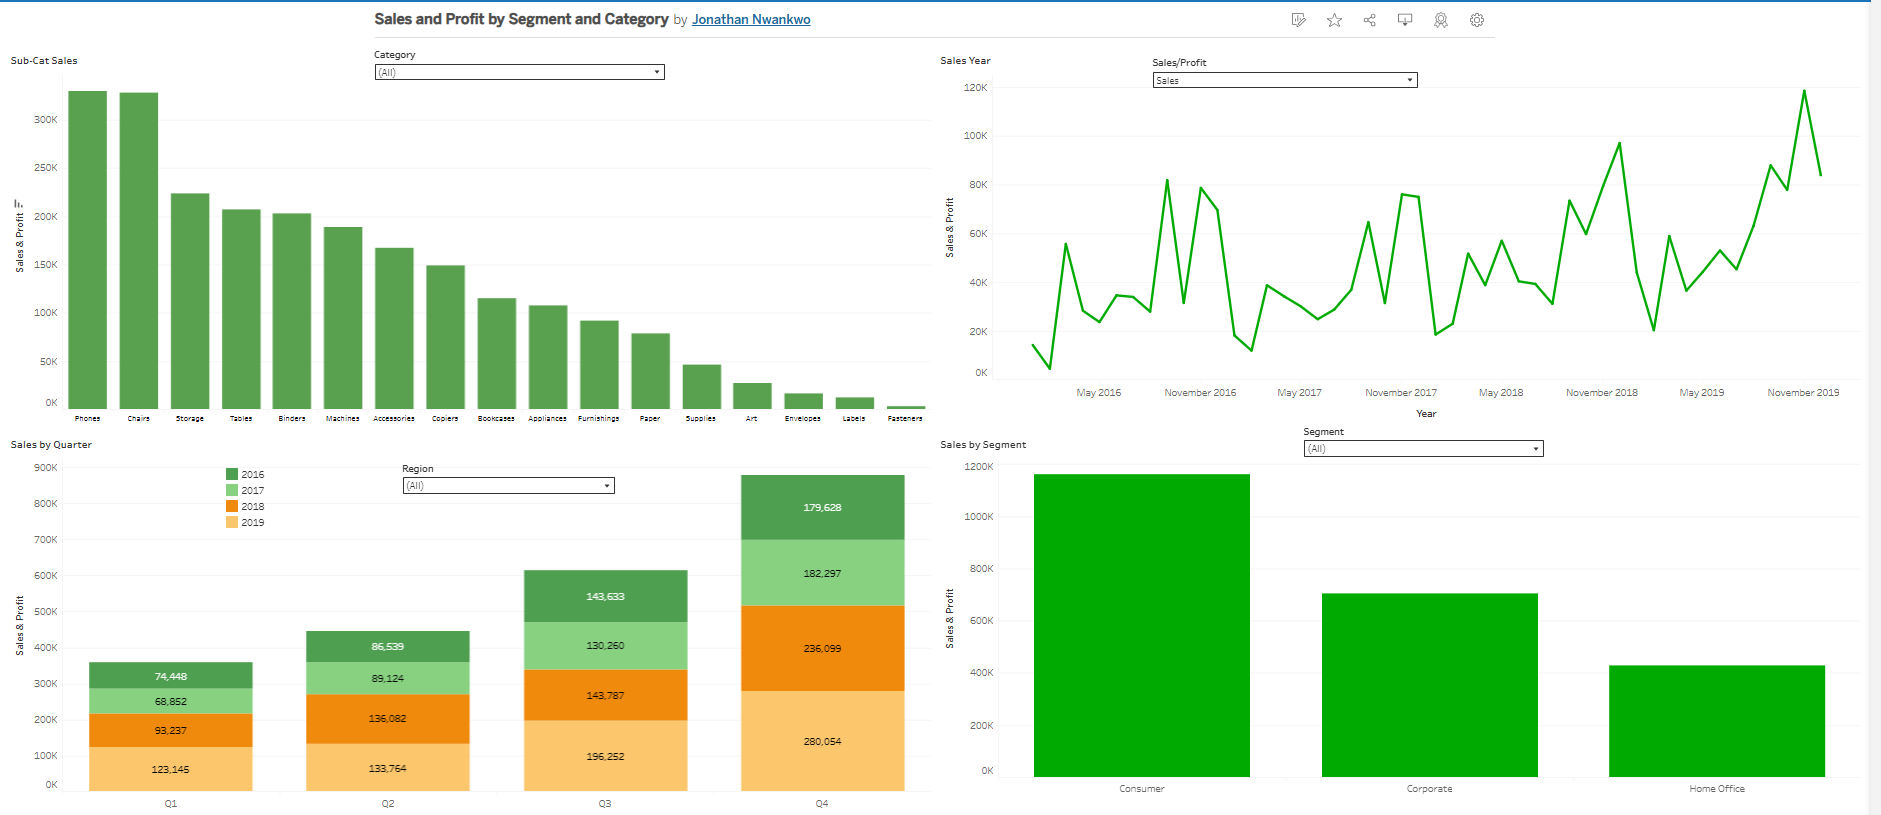
- Sales & Profit Report: Key metrics (₦56.25M revenue, ₦32.32M profit, 251K orders), quarterly profit trends, top-performing product subcategories, and regional contribution summaries.
- Profit Report: Profit target tracking, profit by channel, profit over time, and top states by profit generation.
- Sales Report: Revenue target tracking, revenue by channel, regional and state revenue maps, and revenue by product categories.
- Applied interactive filters (year, channel, region, promotion) for deep-dive analysis.
- Analysis:
- Identified South East as the top-performing region (₦16M sales, ₦9M profit).
- Determined Computers (₦22M) and Cameras (₦17M) as key product drivers.
- Found Outlet channel as the dominant sales and profit contributor (₦32.2M revenue, ₦18.4M profit).
- Highlighted targeted promotions (Adventist, Deeper, Winners) as high-impact order generators.
- Forecasting model flagged a revenue dip in early 2015, enabling proactive strategy planning.
Result
- Delivered a fully integrated analytics system that reduced manual reporting time by over 65%.
- Enabled leadership to focus on top-performing regions, channels, and products, increasing quarterly sales by an estimated 10–15%.
- Supported data-driven promotional planning, improving campaign ROI by reallocating budget to high-response promotions.
- Improved revenue forecasting accuracy, enabling early intervention during projected downturns.
- Provided a one-stop performance view for executives, combining operational, financial, and marketing insights.
Portfolio Value: This project demonstrates my ability to design and deploy enterprise-level analytics dashboards that merge historical tracking, forecasting, and promotional impact analysis into a single, interactive system — empowering executives with real-time insights for strategic and tactical decision-making.


Leave a comment (0 comments)