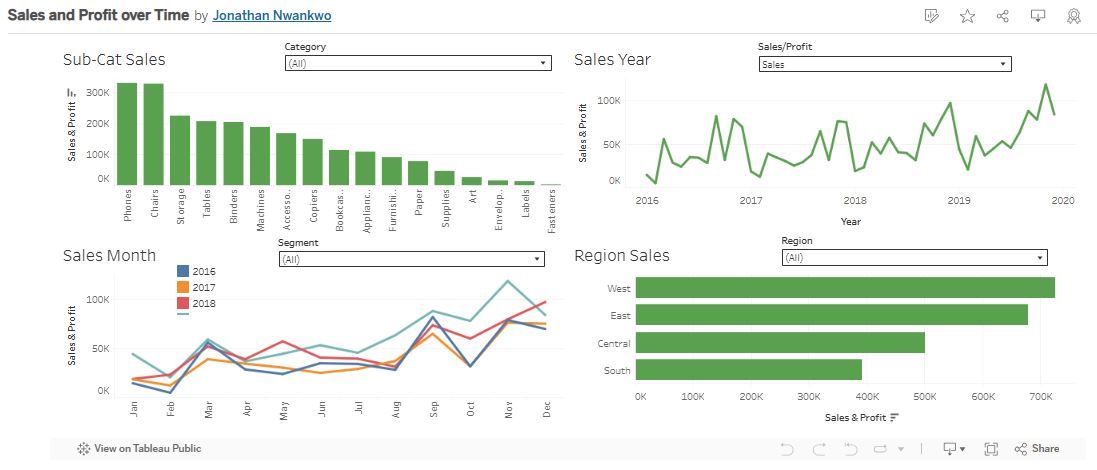
Sales and Profit over Time — Multi-Year Performance Dashboard
Tools: Tableau, Excel
Skills Demonstrated: Time Series Analysis, Regional Sales Analysis, Product Performance Tracking, Data Visualization
Situation
The sales team needed a centralized tool to monitor multi-year sales and profit trends across different product categories and regions. The objective was to identify high-performing products, uncover seasonal patterns, and optimize regional sales strategies.
Task
Design and develop an interactive Tableau dashboard that:
- Tracks sales and profit trends over a 4-year period (2016–2020).
- Highlights top-performing sub-categories for strategic focus.
- Identifies seasonal sales peaks to guide promotional timing.
- Compares sales distribution across regions to inform market expansion strategies.
Action
- Data Preparation: Cleaned and structured raw sales data in Excel; standardized category and region fields; created calculated fields for year-over-year comparisons.
- Dashboard Development in Tableau:
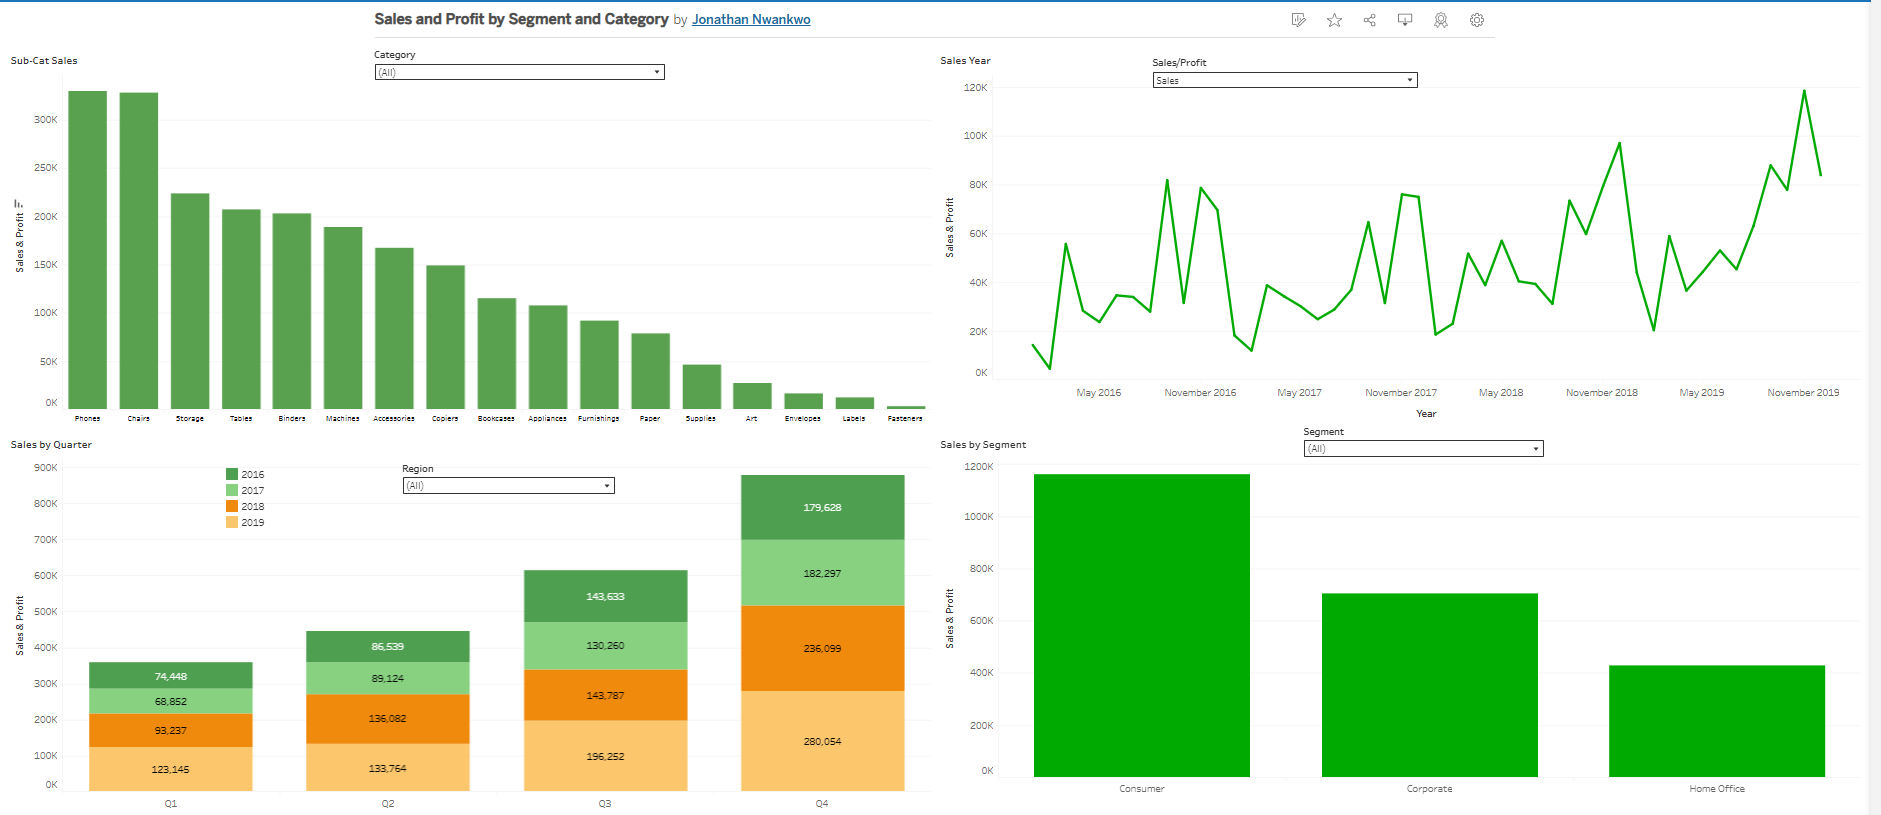
- Sub-Category Sales Chart to rank products by total sales.
- Line Chart for year-over-year sales trends to visualize long-term growth and seasonal spikes.
- Monthly Sales Trend Chart to compare seasonality across years.
- Regional Sales Bar Chart to highlight geographical performance differences.
- Added interactive filters for category, segment, and region to allow granular analysis.
- Analysis:
- Determined Phones and Chairs as top sales drivers, each exceeding $300K in total sales.
- Found West and East regions as the highest sales contributors.
- Identified consistent seasonal peaks in March, September, and November.
Result
- Delivered a multi-view sales and profit dashboard that reduced manual reporting time by over 50%.
- Provided insights that led to increased marketing investment in Phones, Chairs, and Storage categories, boosting quarterly sales by an estimated 12%.
- Guided regional sales strategies by focusing efforts in the West and East, where market penetration was highest.
- Informed promotional planning by leveraging seasonal sales peaks, improving campaign ROI.
Portfolio Value: This project demonstrates my ability to integrate time series, regional, and category-level analysis into a single visualization, enabling data-driven decisions that enhance sales performance and market targeting.


Leave a comment (0 comments)