Sales and Profit Storyboard by Segment and Category
Tools: Tableau, Excel
Skills Demonstrated: Data Analysis, Data Visualization, KPI Tracking, Business Intelligence
Situation
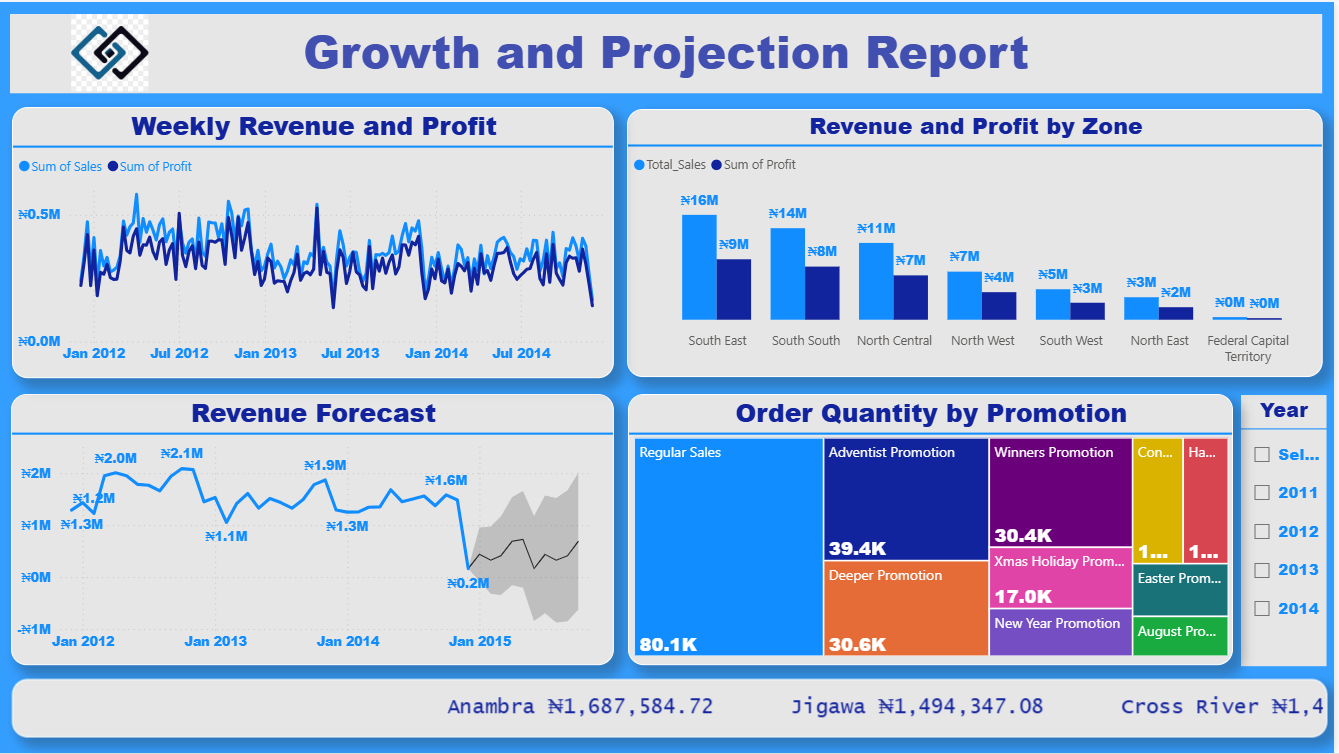
The organization needed a clear, data-driven way to track sales and profit trends over time, identify top-performing products, and evaluate performance by customer segment. The existing reports were static and lacked the interactivity required for quick decision-making.
Task
My objective was to design and develop an interactive Tableau dashboard that:
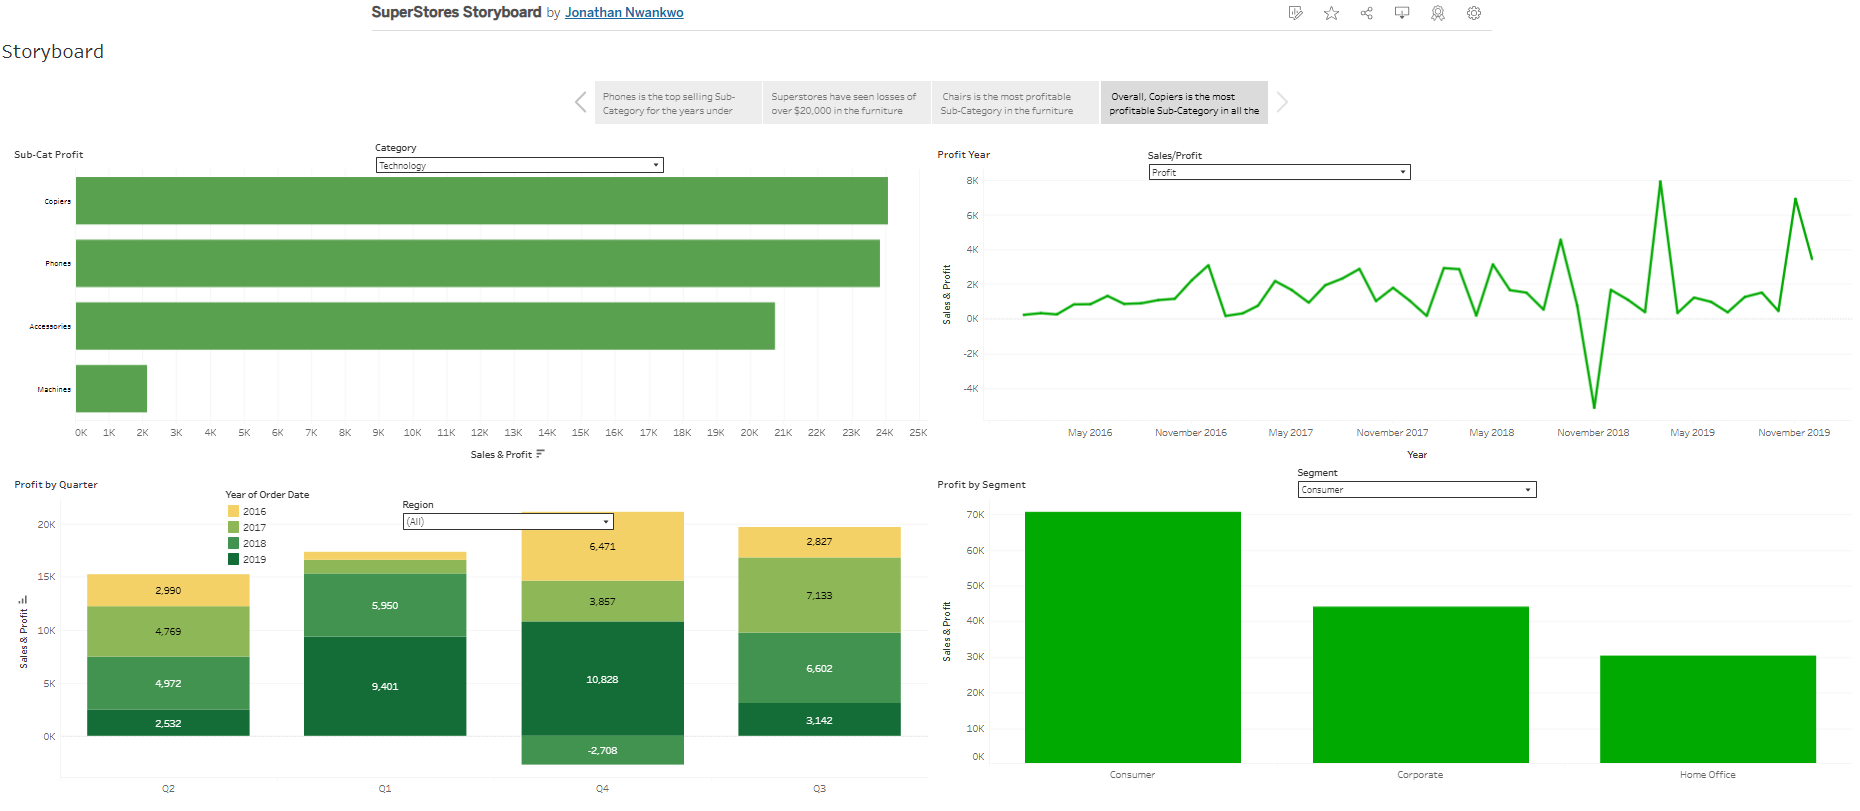
- Highlighted sales performance by product sub-category within the Technology category.
- Tracked quarterly and yearly sales trends to uncover seasonal patterns.
- Compared revenue contributions across Consumer, Corporate, and Home Office segments.
- Enabled drill-down filtering for region, category, and segment to support flexible analysis.
Action
- Data Preparation: Cleaned and structured raw retail sales data in Excel, created calculated fields for yearly and quarterly aggregations, and mapped sub-categories to product categories.
- Dashboard Development:
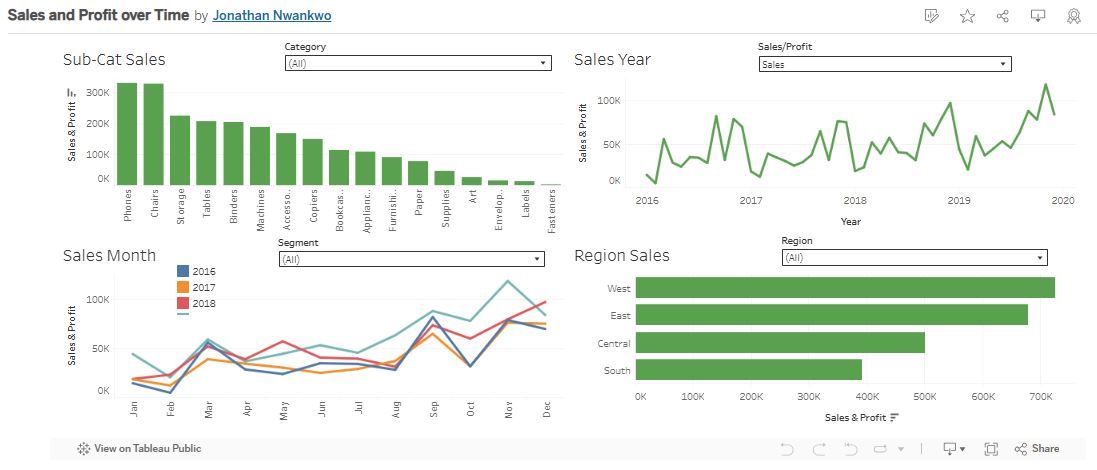
- Built bar charts to compare sub-category and segment sales performance.
- Designed a line chart to show time series sales trends from 2016–2019.
- Used stacked bar charts to visualize quarterly sales performance by year.
- Added interactive filters for category, region, and segment for dynamic analysis.
- Insight Generation: Incorporated annotations and visual cues to highlight high-performing products, peak sales periods, and underperforming segments.
Result
- Delivered an interactive Tableau dashboard that reduced analysis time for quarterly sales reviews by over 60%.
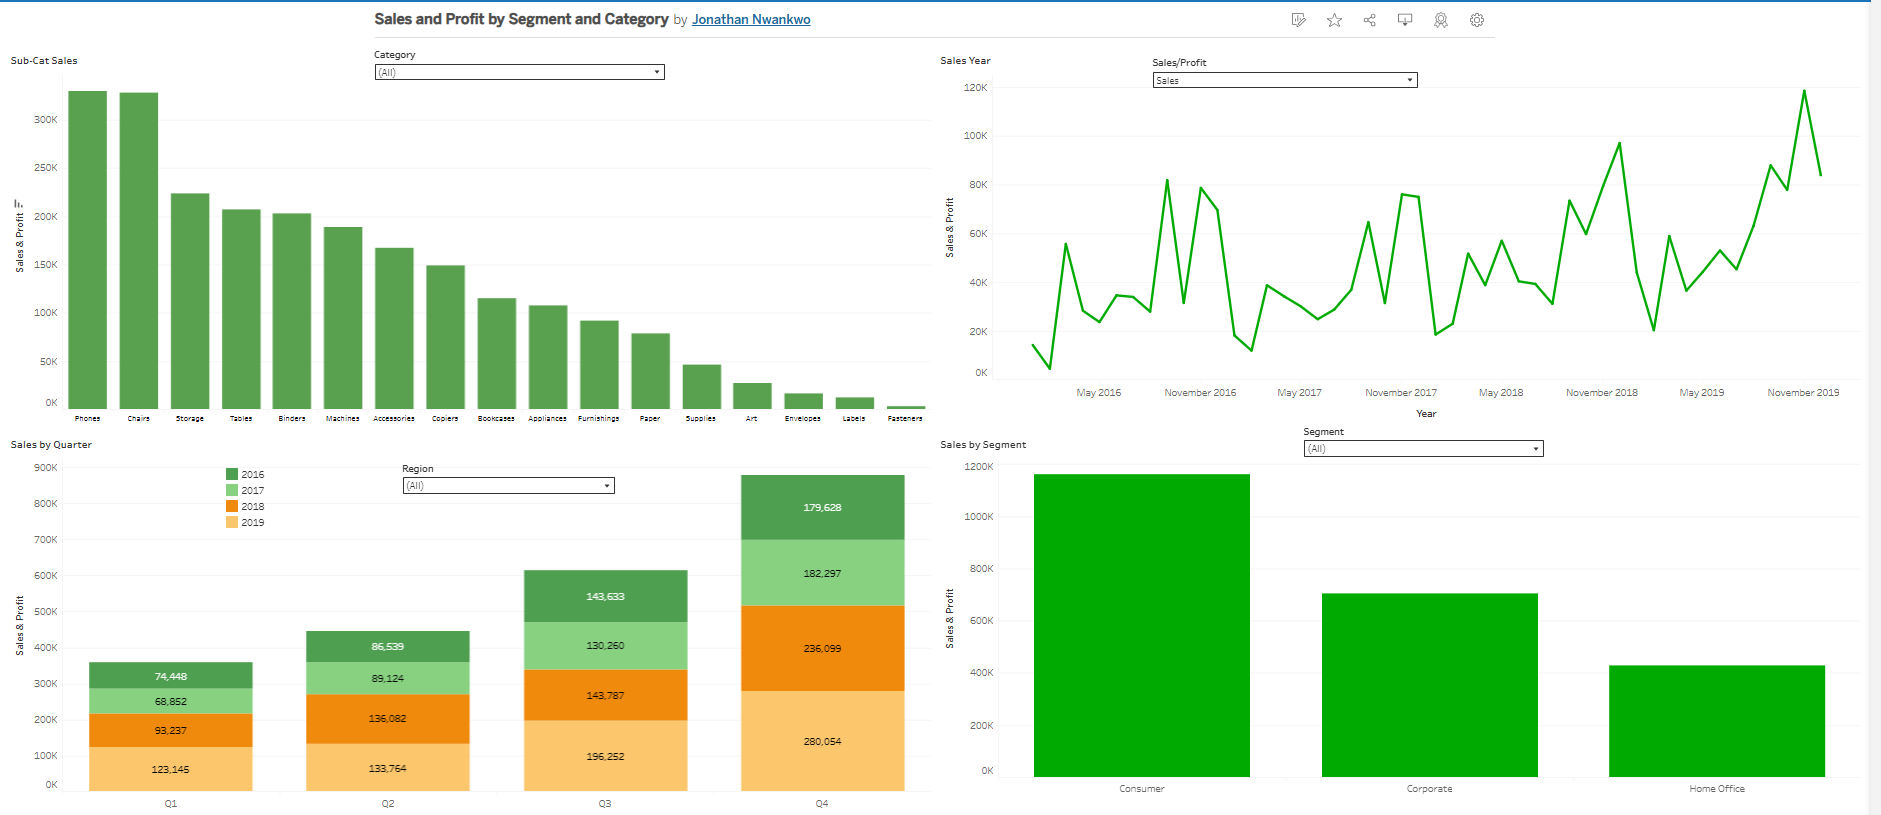
- Identified Phones as the highest revenue driver in Technology, with annual sales exceeding $330K.
- Revealed Q4 consistently outperformed other quarters, with 2019 Q4 sales peaking at over $318K — influencing promotional calendar planning.
- Showed Consumer segment accounted for ~50%+ of total sales, guiding targeted marketing campaigns.
- Provided executives with a self-service tool for real-time KPI tracking, leading to faster, data-informed business decisions.
Portfolio Value: This project demonstrates my ability to combine data storytelling with advanced visual analytics to create business intelligence solutions that directly support strategic decision-making.


Leave a comment (0 comments)