THE COMPANY.
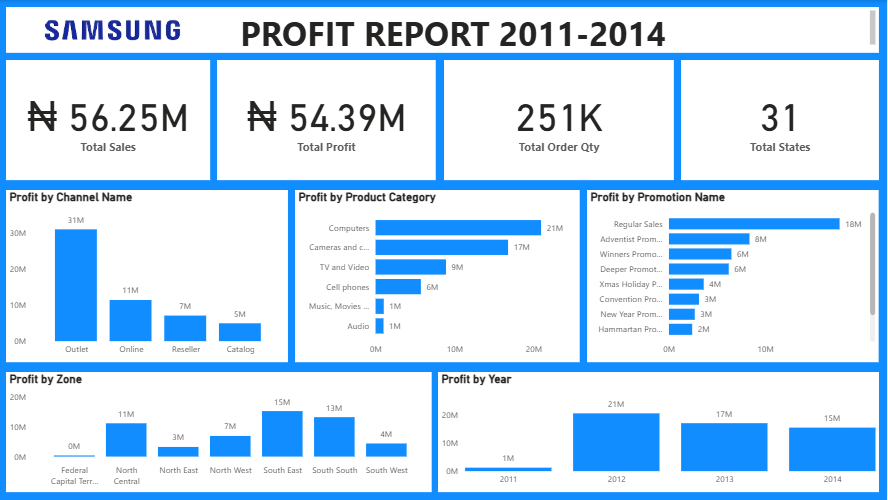
Samsung is a dynamic electronics sales company with a strong presence in Nigeria. From 2011 to 2014, the company has operated across 7 distinct zones that encompass 31 states, indicating a broad operational footprint within the country. With this data, Samsung aims to derive answers to several key business questions they believe are crucial for steering Samsung Electronics towards sustained growth and market leadership.
PROJECT GOAL AND KEY BUSINESS QUESTIONS
To create a Power BI dashboard that provides a comprehensive and interactive view of the company's sales data. This dashboard aimed at unveiling in depth insights from the data will allow Samsung answer questions that will enable them make data-driven decisions to improve sales, increase customer satisfaction and revenue. These key business questions were:
- How have our sales trends evolved from 2011 to 2014?
- Which sales channels, product categories, and promotional strategies have been most effective?
- What profits have we realized over these years, and what are the contributing factors?
- How do sales and profits distribute across the different zones we operate in?
APPROACH
1. Understand the Key Business Questions
2. Collect data
3. Clean and Model Data
4. Analyse and Visualize Data
5. Present Findings and Make Recommendations

Leave a comment (0 comments)